Six Debugging Panels in UiPath Studio

Introduction
In every automation you develop, it is significantly important to understand the inaccuracy and learn how you can reach the root cause. Understanding errors paves the way for creating robust automation. UiPath Studio has some preeminent debugging features that can help you identify and acknowledge the errors that come your way when shaping your automation project.
In this article, you are going to discover the six debugging panels that you can find and explore in Studio which makes our development flow and problem solving easier. Before understanding each debugging panel in detail, let's quickly look at the debugging concept.
What is debugging?
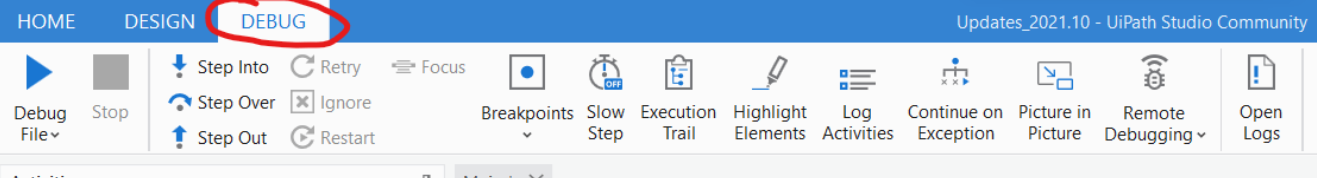
Debugging is a feature in Studio that allows a user to identify, understand, backtrack, and remove errors from the bots. This way you can make the bots more robust and functional as per the requirements and minimize the errors. The screenshot below shows where you can find the debugging option in Studio.
Now, let's dive into understanding each debugging panel.
Debugging panels
The locals panel
To easily understand what Locals panel is used for, I will relate the concept to a real-life example. Let's suppose a stranger comes to your local area and asks you for a place to visit. You will easily be able to give directions and guidance.
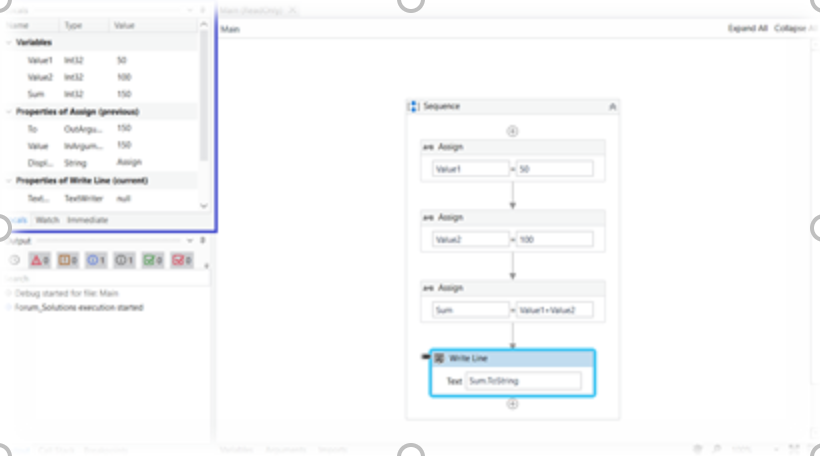
In the same way, Locals panel knows everything about a process such as variables, variable values, runtime values, and arguments, and you can easily view the values when you are running the workflow. Let us see a screenshot below of Locals panel.
The watch panel
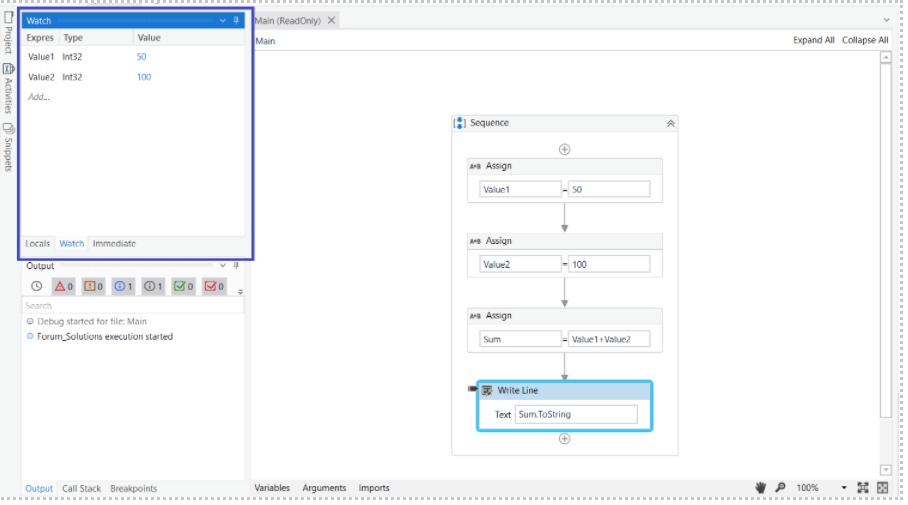
Watch Panel (as the name suggests) is used to watch something specific. In Studio, it is used to watch the variables and arguments values. And this is a particularly useful panel, while debugging, we do not have to search for the variables value in the output/local panel since we can directly monitor specific variables.
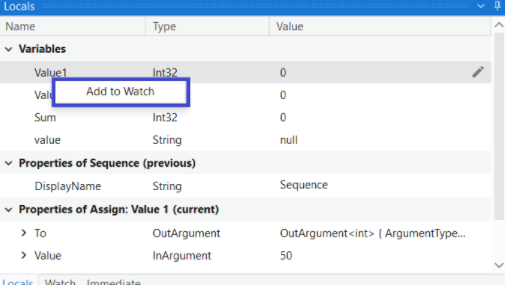
Now, let us understand diverse ways of adding variables to the Watch panel.
1) Add via right-click from Locals
2) Add via the add-in Watch panel
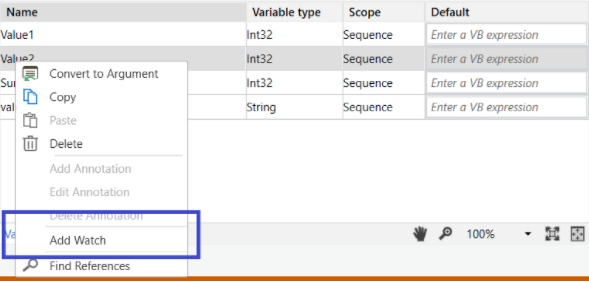
See the screenshot below of Watch panel.
The immediate panel
Immediate panel in debugging is used to act immediately. The Immediate panel goal is to see values, variables, or arguments and to evaluate an expression and output the result. For example, if you have two integer values A & B and you want to see the value of A*B, you can do that in the Immediate panel.
Let us see a similar example in the screenshot below.

The output panel
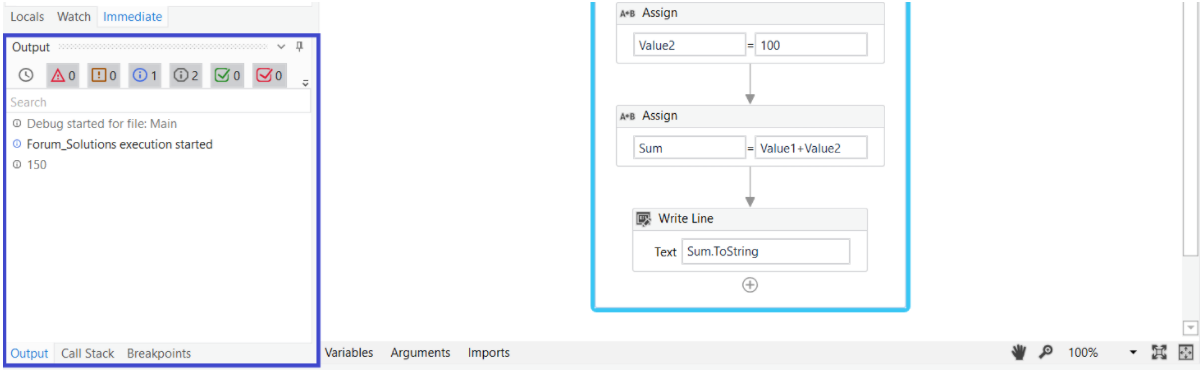
Output panel is used to see the log message or any custom value that we are writing using Log Message or Write Line activity. It is also used to notify information regarding packages installation, remote debugging states, etc.
Note: The output panel is also available outside the debugging process. It also shows the execution start and end time in the screenshot below. This panel also categorizes the log messages into distinct categories like warning, information, trace, error, and test results in Failed and Passed Assertions.
The breakpoints panel
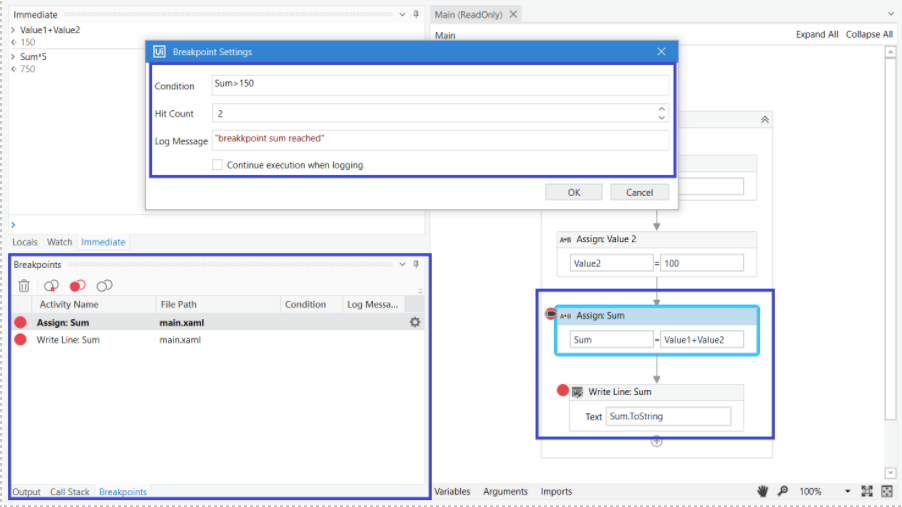
Breakpoints are used to pause workflow at any given point and monitor the values or check if the workflow is running as expected. Breakpoints panel helps to monitor the breakpoints in the workflow. It shows which activity has the breakpoint and is present in which Extensible Application Markup Language. It is also used to give conditions at break points.
The screenshot below explains every aspect of Breakpoints and Breakpoints Panel.
The call stack panel
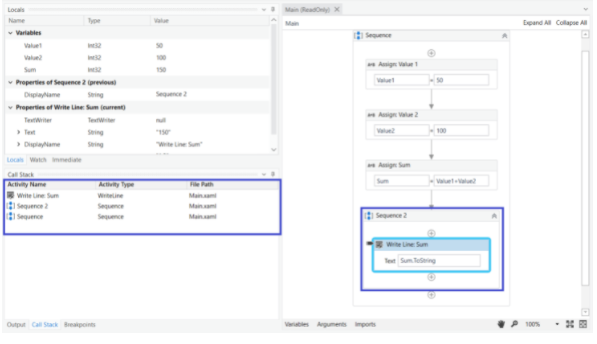
The Call Stack panel is used to see the upcoming task to be performed within a particular sequence. It shows three things: activity name, activity type, file path.
The Call Stack panel is immensely helpful when there are heavy workflows. We can use it to highlight the currently executing activity within the workflow. Below is a screenshot of the Call Stack panel.
Conclusion
Debugging is an important process to identify and remove errors. Generally, it is recommended to perform it during the design stage of the automation project to assure high quality. As we discovered there are several panels that makes it easier to view the debugging process, add values or monitor variables and arguments.
Topics:
Studio
Consultant, WonderBotz
Related articles