Working with PowerShell: How to Analyze UiPath Projects from Command Line

Microsoft PowerShell consists of a command line shell and its associated scripting language. It is a great tool to integrate with UiPath Studio and its packaged command line executable to automate tasks such as project analysis.
In this tutorial, we will dive into integrating PowerShell scripting with automation projects built with Studio. By the end of this tutorial, you will fully understand how to use Workflow Analyzer CLI Script, which is a script I built to export the results of Studio’s Workflow Analyzer tool to file. This is all done from the command line without even having to open the Studio application.
You will also understand how I went about building this script and why I think it is important. This will give you the knowledge to build your own scripts that can improve your day-to-day interactions with UiPath software and the end-to-end automation pipeline!
Requirements
Before getting started, you will need the following:
Microsoft Windows (version 8.1 or higher) or Microsoft Windows Server (version 2012 or higher).
The ability to run PowerShell as an Administrator and set the execution policy to “bypass” to allow the current session to run scripts not digitally signed.
UiPath Studio (version 2019.10 or higher).
Step 1: How to use Workflow Analyzer in Studio
In this first step, we will be looking at how to typically use Workflow Analyzer from within the Studio application. This is to ensure we have a baseline understanding of the feature. We’ll also get familiar with its usual functionality and what to expect from it before moving on to running it from the command line.
Workflow Analyzer is a static code analyzer that ensures your automation meets high quality and reliability standards. Workflow Analyzer is part of Studio versions 2019.10 and higher. There is a default set of rules used by the analyzer which are based on our Automation Best Practices such as variable and argument naming, empty sequences or workflows, package restrictions, etc. The rules can also be configured to something specific to your organization or project and various inconsistencies you want to check for with the analyzer. This is powerful because it can be implemented to prevent executing code or publishing automations that contain any specific errors or warnings you want to catch. The analyzer ‘catches’ them for you.
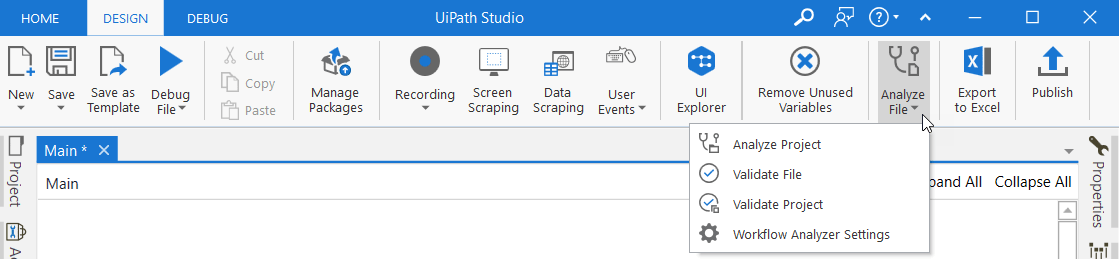
Workflow Analyzer is accessible from within the Design ribbon tab in Studio and can be used by clicking either Analyze File to perform an analysis on the file currently focused on in the Designer panel or Analyze Project to analyze all files in the current project.

Each rule caught by Workflow Analyzer has an ID, description, and recommendation. For example, ST-NMG-001 is broken down as follows:
ST means that the rule is built into Studio.
NMG means that the rule is part of the Naming Rules category.
001 is the rule number within the NMG category.
Now that you know how to run Workflow Analyzer from within Studio itself and have seen an example of what to expect from its results, we can move on to running the analysis from the command line. For more on how the analyzer works from within Studio, check out the documentation covering it.
Step 2: How to use Workflow Analyzer via command line
Before moving on to the final step of running the analysis via the script I built, we must first understand how to run the analysis from the command line and why its important. As of the 2020 LTS (Long-Term Support) release of Studio, version 2020.10, Studio does not have the ability to export the results of the Workflow Analyzer to file when ran from within the application.
Instead, the product provides the command line executable to run the analysis via the command line, and in turn, these results can be piped to file. In other words, the results can be redirected from printing directly in the command line shell to instead be printed into a new file. As previously noted, this is powerful because it can be implemented to prevent executing code or publishing automations that contain any specific errors or warnings you want to catch that are caught by the analysis, but now this can all be done without having to open the Studio application. This provides the benefit of being integrated into your organization’s Continuous Integration / Continuous Delivery or Deployment (CI/CD) pipeline configurations! This is how (and why) I thought of building out this script, which is covered further along this tutorial in step 3.
But first, to just run Workflow Analyzer from the command line using Studio’s command line executable, you will need to provide two (2) values:
1. The file path to Studio’s command line executable. By default, this is set to “C:\’Program Files (x86)\UiPath\Studio\UiPath.Studio.CommandLine.exe”, which is the executable’s location if Studio was installed in Service Mode. It will instead be “%LocalAppData%\UiPath\[Studio_version]\UiPath.Studio.CommandLine.exe” if Studio was installed in User Mode, replacing “[Studio_version]” with the actual name of the version folder in that path.
2. The path to the “project.json” or individual workflow “.xaml” file to analyze from your automation.
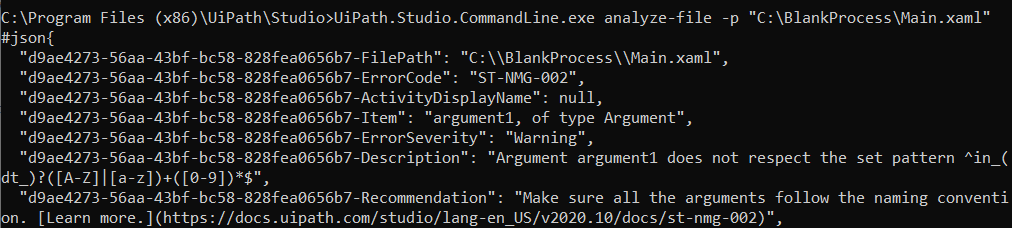
For example, assuming you are within the directory containing the Studio command line executable, you can run Workflow Analyzer on an individual workflow file located at “C:\BlankProcess\Main.xaml” by running the following from within the command line:
UiPath.Studio.CommandLine.exe analyze-file -p “C:\BlankProcess\Main.xaml”
For more on how the tool works from within the command line, check out the documentation.
Step 3: How to use Workflow Analyzer CLI Script
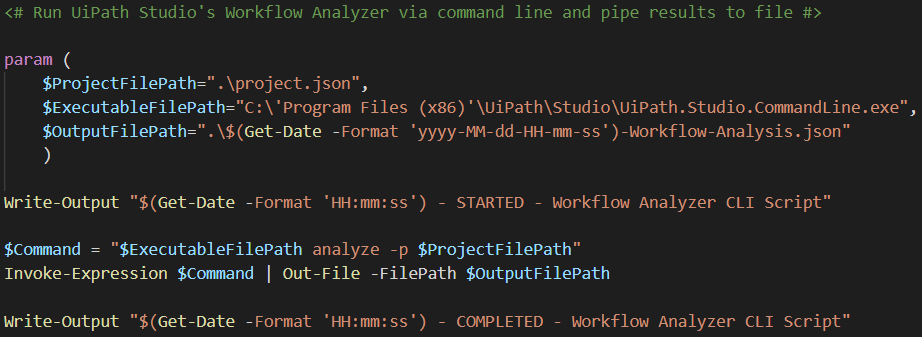
Finally, we are ready to cover how running Workflow Analyzer via Workflow Analyzer CLI Script helps improve this experience and eases how it can be incorporated into an error or warning check pipeline. Like how running the tool via the command line works, the script also needs the same two (2) values as before, those being 1) the file path to Studio’s command line executable and 2) the path to the project or workflow file to analyze, plus a new third value being 3) the output file path. This represents where the results of Workflow Analyzer should be piped.
To follow along and use Workflow Analyzer CLI Script, you can download it here, but you must first sign up with an account on UiPath Marketplace.
By default, the value of where to pipe the analysis results is set to “.\$(Get-Date -Format ‘yyyy-MM-dd—HH-mm-ss’)-Workflow-Analysis.json”. What this means programmatically in PowerShell is to pipe the analysis results to a new file which will be named for the current date and time followed by “-Workflow-Analysis.json”.

Requirement reminder: PowerShell will need to be ran as an Administrator and the execution policy will need to be set to “bypass” to allow scripts to be ran not digitally signed. This is done by running the following from within PowerShell:
Set-ExecutionPolicy -Scope Process -ExecutionPolicy Bypass
For example, assuming you are within the directory containing “Workflow-Analyzer-CLI-Script.ps1”, Studio was installed in Service Mode. Which means that your command line executable is located at “C:\’Program Files (x86)\UiPath\Studio\UiPath.Studio.CommandLine.exe”. If you just want to pipe the analysis results to a new file named “Workflow-Analysis.json”, you can analyze a project file located at “C:\Date-Reminder\src\project.json” by running the following from within PowerShell:
.\Workflow-Analyzer-CLI-Script.ps1 `
ProjectFilePath “C:\Date-Reminder\src\project.json” `
ExecutableFilePath “C:\’Program Files (x86)’\UiPath\Studio\UiPath.Studio.CommandLine.exe” `
OutputFilePath ”.\Workflow-Analysis.json”
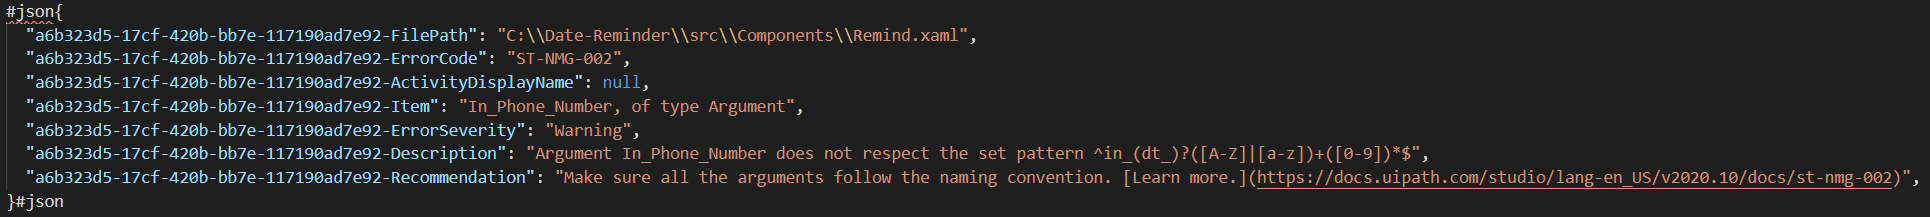
Congratulations! You should now see “Workflow-Analysis.json” in the same directory you ran the script in. Open it up and you can see what the analysis results look like fully fleshed out in JSON.
Conclusion
In this tutorial, we started off by ensuring we had a preliminary understanding of the UiPath Studio Workflow Analyzer feature. This included how to use it under normal circumstances from within the Studio application and what the end goal of its usage is.
Then, we dove into running the analyzer from command line without having to open the actual Studio application. Finally, we finished up with an example of how we can use PowerShell scripting in combination with Studio’s command line executable to simplify things, such as running Workflow Analyzer with Workflow Analyzer CLI Script. We covered how I went about building this script, reading user input, and exporting the results of the analysis.
Now, you should understand why this type of scripting is important and how it can be used to improve your end-to-end automation pipeline. Scripts like these can be easily integrated with warning or error check pipelines to prevent an automation from executing or publishing if one of your organization’s custom rules catches something you do not want to run or be pushed to production.
Hopefully, with all of this in mind you can even start working towards building your own PowerShell scripts. I am always interested in hearing new ideas, so please feel free to reach out to me if you want to crunch some scripting or pipeline integration troubleshooting!
Technical Advisor, UiPath
Related articles