UiPath Insights - Well Measured, Well Managed
“What’s well measured gets well managed.” You've probably seen or heard this phrase a thousand times when it comes to business intelligence and analytics. Rightfully so, it’s catchy and usually accurate.
You can see it on the Insights product webpage, we talked about it in our product launch webinar in late 2019, and it’s even recently been adopted by some other robotic process automation (RPA) players too! It means exactly what you’d expect—when you can accurately measure your operations with the right key performance indicators (KPIs), you can make more informed decisions when managing your business. UiPath Insights already provides the most complete RPA analytics solution available on the market, and with our latest 20.10 release, we’ve added new features to enhance how you well manage (*wink wink*) your deployment.
Let’s kick things off with a deep dive into our first step towards more granular dashboard role-based access control (RBAC), a feature we’ve called Dashboard Management.
In previous releases, all out-of-the-box dashboards were shared with every new user created on Insights, regardless of permission level. We understand that not every user wants to see all of those dashboards, and maybe not every user should because of your company’s security policies. With Dashboard Management, you now have the option to share default dashboards with users based on the Insights permissions assigned to them in UiPath Orchestrator. The options look like this:
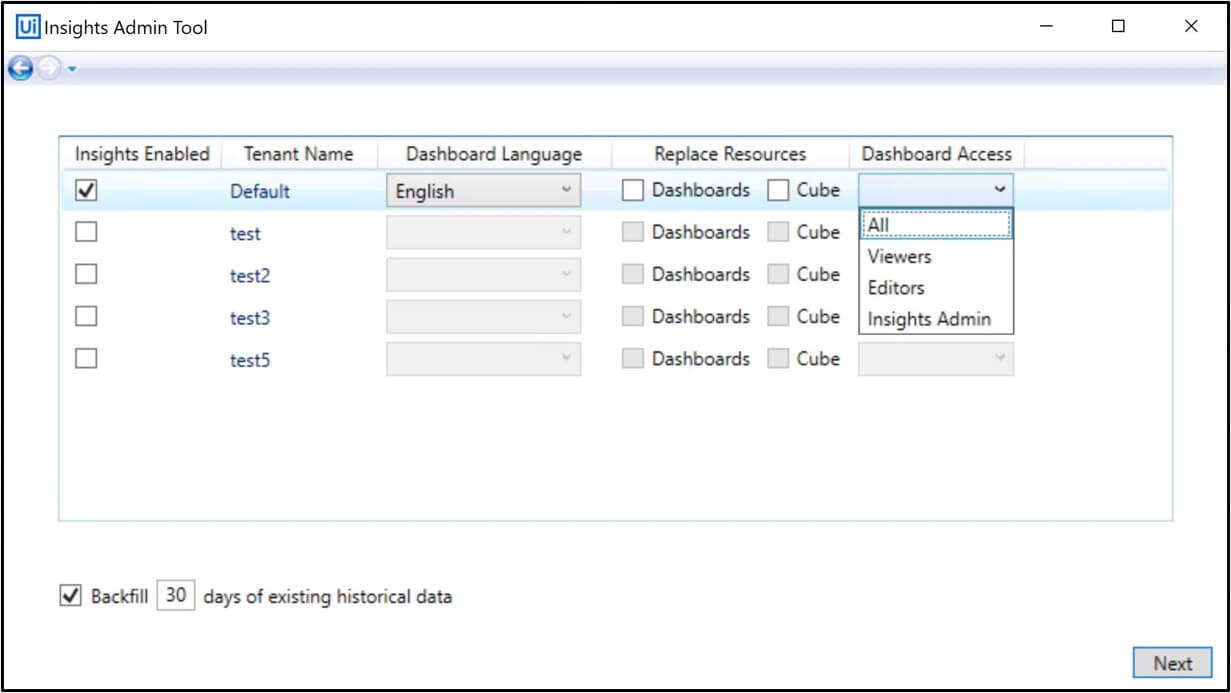
All - the default dashboards are shared with all Insights users.
Consumers - the default dashboards are only shared with users who have View permissions to Insights.
Editors - the default dashboards are only shared with users who have Edit permissions to Insights.
Insights Admin - the default dashboards are not automatically shared with any Insights users—the Insights Admin user shares them manually from the Insights portal.
You should think about leveraging the admin option if you only want the default dashboards to be seen by a specific group of users, or if you know that you’ll want to make changes to the dashboards before anyone can see them. The admin has the power to share the dashboards with the same groups listed above, or with specific people of your choice. You can also go this route if you want to share specific out-of-the-box dashboards with different audiences on a per-dashboard basis. For instance, maybe you want your business analysts to see the ROI dashboard but not the processes dashboard. As long as you have the names of these users and they’re Orchestrator users with Insights permissions, you’re good to go - each dashboard can be shared individually!
And speaking of dashboards, I hope you’ve taken advantage of our custom dashboarding capabilities. When we say you can customize a dashboard, it means that you can do a whole lot more than just adjust the filters and save as a new copy. Feel free to drag and drop widgets from one dashboard to another, edit any existing widgets all the way down to the formula level, delete anything we’ve added, or even create your own widgets and dashboards from scratch. Most of the dashboard creation that I’ve seen has been related to business processes where customers want to track specific KPIs that relate to why they implemented automation in the first place. A bank, for example, might be really interested in a dashboard about loan processing that tracks things like the number of loans processed, the total dollar amount, how many applications were filled out incorrectly, the most common loan rejection reason, and a whole lot more.
We’ve also revamped the way we treat custom tables in this release, making the process of building custom dashboards a whole lot smoother! The 20.10 release introduces Custom Table Management, a multi-faceted feature allowing you the option to select which processes and queues should have custom tables created for them in the Insights cube.
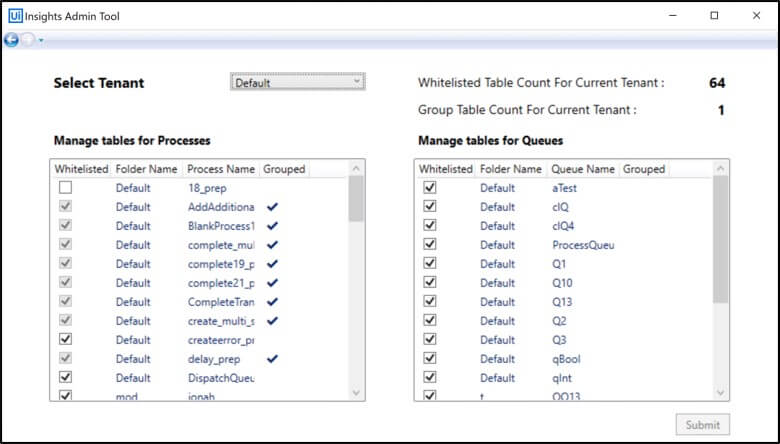
In previous releases, all processes with custom log fields in the last log message, as well as any queues with custom fields, were automatically given a table in the Insights cube. Due to our ability to support a maximum of 75 custom tables per cube, these tables added up quickly and could cause cube build failures if you had passed the limit and didn’t know it. We’ve added a special check for that now, making sure to alert you before you hit that 75 table limit so that you have ample time to remove unneeded processes and queues from the whitelist. The alert threshold is set to 50 by default, but you can always increase or decrease this number based on your deployment performance (just remember, you can’t sneak past that 75 max limit).
When it comes to building informative dashboards, many of you don’t even need most of the process and queue tables that pop up in the Insights cube. The majority of those processes and queues are meant for testing purposes, or to be a stepping-stone to the outcome you’re actually trying to track. The extra fluff can make it hard to find the fields you’re looking for when you use the field picker, especially if a lot of processes and queues have similar names. You can now declutter this experience by whitelisting what you need to build your dashboards, without worrying about sacrificing any of the other data that you want to keep for the rest of the processes and queues in your tenant. We’ll hold all of that data for you inside of the Insights database, so you never have to worry about your table choices being set in stone. If you decide to add or remove some tables, the data will be right there waiting for you.
Now that we’ve covered the management aspect, let’s quickly dive into some tips for measuring what matters. As you identify business processes for automation, make sure that you think about the kinds of metrics you’re trying to track from the get-go. As the automation workflow gets more and more mature, it’s going to become increasingly difficult for an RPA developer to make the changes needed to record the values of the variables that you’ll later need to build your dashboards. Business analytics isn’t something that can be tackled at the last second—it requires some planning and strategy.
One thing you should do to ensure data completeness is to build the dashboards you want on a nonproduction or testing environment. In that phase, you still have room to make whatever changes are necessary to capture what you need. If you wait until the process goes into production to build your dashboard, you might be in for an unpleasant surprise when you go to look for a data point and it’s not there. Even if you make the workflow changes at that moment, any previous data for that process is immutable—meaning, it can’t be changed or revised. You don’t want to lose that valuable information, so just make sure to let your RPA developers know your data requirements before they get started. As a previous RPA dev, I can promise you that having this info at the beginning can save weeks of development time.
And finally, I have one last tip: USE QUEUES! They are the key to helping you track business variables in transactional processes.
To learn more about what is included in the 20.10 release, check out our 20.10 release series set.
Topics:
Insights
(Previously) Principal Product Manager, UiPath
Related articles