
How to Monitor and Report on Automation Data
Share at:

Introduction
Implementing automations helps businesses ease the working flows and bring more value to day-to day work. For each automation deployed, there is a need to monitor the infrastructure and ensure that robots run seamlessly. This blog will explores two options that can help in tracking UiPath Orchestrator infrastructure.
Monitoring via console
UiPath Orchestrator provides the option to check the health of all the running processes and machines. Each component provides the user with the option to view it at a general level as well as at an individual level.
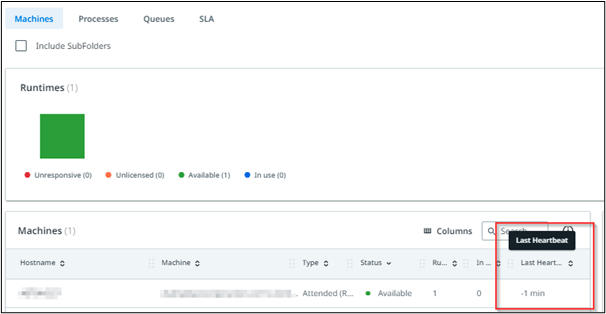
In the cloud Orchestrator go to your tenant, click on the Monitoring tab, and then select the folder and the Machines, to see the health of the machine.
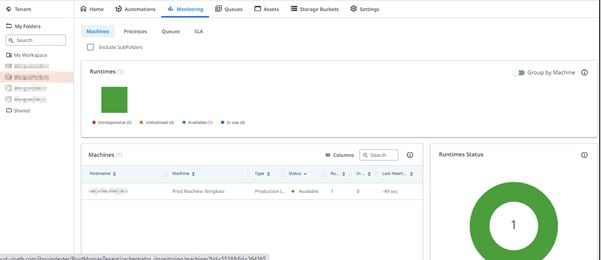
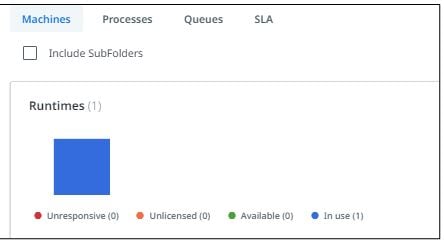
In the below image, there's a distinct color coding used depending on the state of the machine. In the screen shot below, the blue color denotes that the machine is currently in use, indicating that there are processes running on this machine.
This same screen shows the last heartbeat, for example the last successful connection to the machine. This heartbeat service keeps checking the connection every 30 seconds.
The heartbeat service can be used to check the unattended session from Orchestrator > Tenant > robots option as shown below. The session needs to always be connected for the processes to run.
Similarly, you can check the health of your processes as well from Monitoring > Processes option.
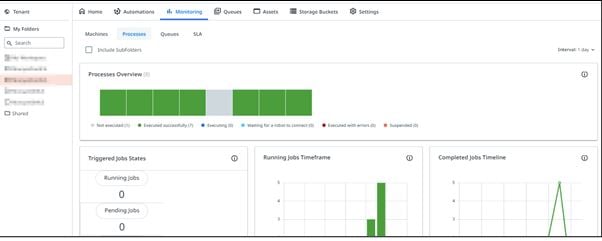
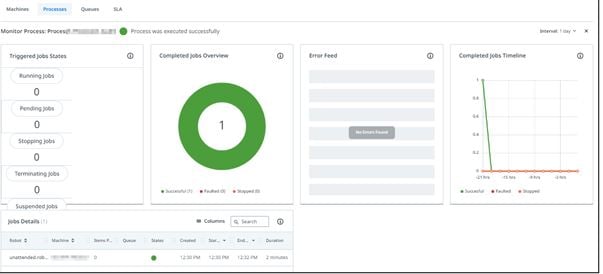
To check the health of the individual process, simply hover the mouse on the process overview bars and click on it to check the health of the individual process. See below.
Note: The resolution is minimized here to get all the page details on the same page. You may need to scroll down on Orchestrator to see all the options.
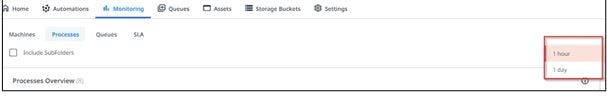
The health of the processes can be filtered for the past one hour or past one day, as seen from the Interval option in the screenshot below.
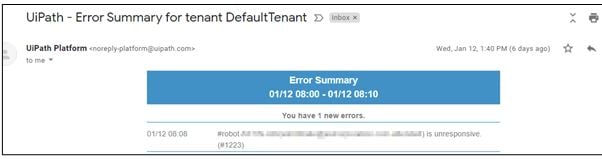
Additionally, there's an option in the cloud Orchestrator to get email notifications for the health of the tenant.
With this option an email is sent once a day and it's not configurable. This provides a high-level tenant health summary. See below.
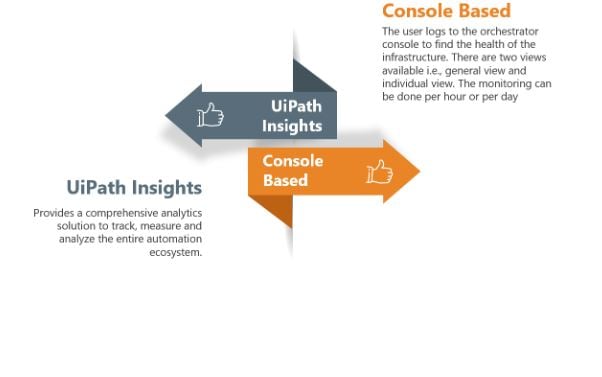
RPA analytics with UiPath Insights
UiPath Insights uses data from Orchestrator and Robot logs to track, measure and report on performance. The dashboards provide RPA leaders and business users a detailed summary of their automations. Insights users can drill down on specific metrics for further analysis.
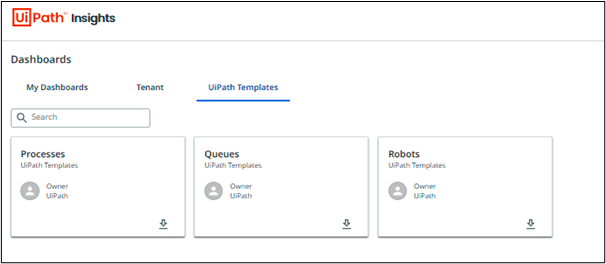
Let's view in detail. When you open UiPath Insights, you'll see three pre-built templates that allow you to track robots, processes, and queues across tenants.
There's a fourth template called Business ROI for which the ROI Viewer or ROI Editor permissions are needed. Note: This ROI Dashboard template will be locked until an Insights administrator configures the ROI dataset.
The Processes template allows you to view pre-built metrics across all job processes.
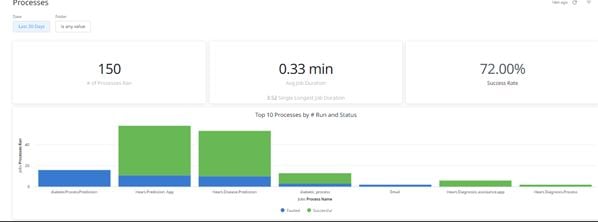
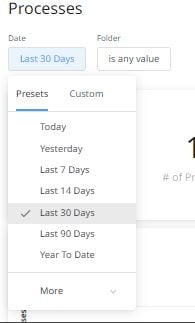
By default the processes template is filtered to display the last 30 days. This can be easily changed as shown below.
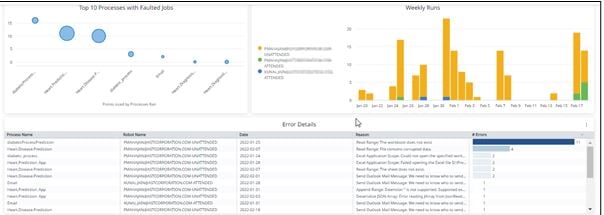
The dashboard also includes various other tiles, including Top 10 Processes with Faulted Jobs, in addition to Weekly Runs.
If you want to customize this dashboard, you'll need Designer permissions to copy the dashboard to My Dashboards tab.
Similarly, the following dashboard is displayed when you select the robots pre-built template.
It provides comprehensive details for Robot usage (both attended, and unattended) as well as the total usage in hours. This allows stakeholders to quickly determine the available bandwidth for the robot so that it can be used for additional automation opportunities. The automation objective should be to use the robot close to 24/7 (for unattended robots) to derive maximum of benefits for the automation.
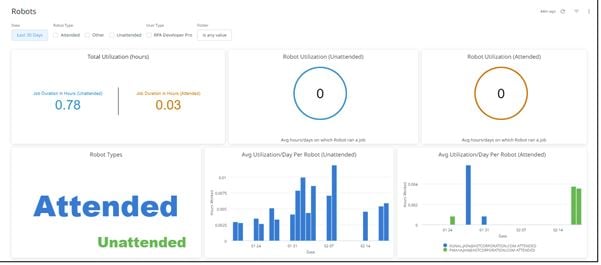
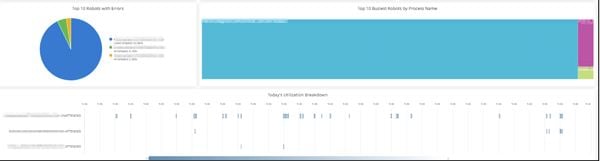
This dashboard also allows you to see the Top 10 robots with Errors or the Top 10 Busiest robots by Process Name.
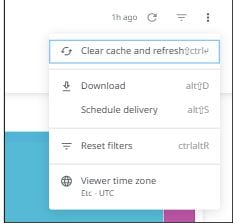
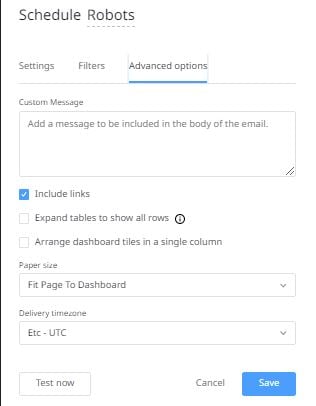
There's an additional option at the top right that allows to download or even schedule delivery for these reports.
There are various options for the schedule delivery, including the time of delivery and the output format (PDF, CSV, Zip, or PNG).
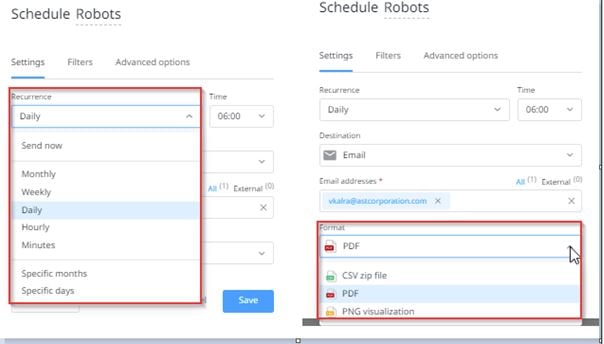
Additionally, filters can be applied to the report based on the Robot/User type and Folder.
Conclusion
UiPath Insights is a robust RPA analytics tool to track, measure and report on your automation program. It is significant for optimizing your automations and gaining visibility into your entire automation ecosystem. If you want to derive more benefits from your automations, explore UiPath Insights and leverage its rich, built-in dashboard experience.
Vishal Kalra is a Sr. Principal Consultant at AST LLC

Architect , Applications Software Technology LLC (AST)
Related articles


Get articles from automation experts in your inbox
SubscribeGet articles from automation experts in your inbox
Sign up today and we'll email you the newest articles every week.
Thank you for subscribing!
Thank you for subscribing! Each week, we'll send the best automation blog posts straight to your inbox.