Optimizing Processes with UiPath Process Mining

Summarize:
Introduction
Rapidly changing business environments push organizations constantly to improve their processes to increase efficiency and reduce costs. However, identifying bottlenecks and issues in processes could be a complex and time-consuming task depending on the complexity of the process. A process may have multiple departments and stakeholders involved in completing the tasks. The usual expectation of process discovery is to identify the proper steps of the process. However, there can be many variations in the steps performed. Identifying issues in such processes manually could be time-consuming.
There are many tools in the market to analyze processes and find areas of improvement. UiPath Process Mining is a state-of-the-art tool that enables organizations to visualize and analyze their processes, identify bottlenecks, and optimize them for maximum efficiency.
Requirements
Before getting started, you'll need the following:
Basic understanding of robotic process automation (RPA)
Overview of process discovery
Process discovery with UiPath Process Mining
Process mining is an automated, data-driven, and fact-based process analysis method. UiPath Process Mining uses digital footprints left behind by software applications such as ERP applications, CRM applications, databases, and many more to analyze and monitor the processes. It converts digital footprints into event logs to generate visualizations and insights. Event logs contain information about the activities performed, such as the date and time of the event, activities performed, personas involved, the outcome of the activity, etc.
These insights enable organizations to visualize their end-to-end process, identify variations, identify bottlenecks and issues, monitor performance in near real-time, and optimize accordingly to achieve the best efficiency levels. The visualizations provided by Process Mining include process maps and charts that can be customized based on various parameters, such as time, department, person, and variations, to provide insights based on the selected level of detail.
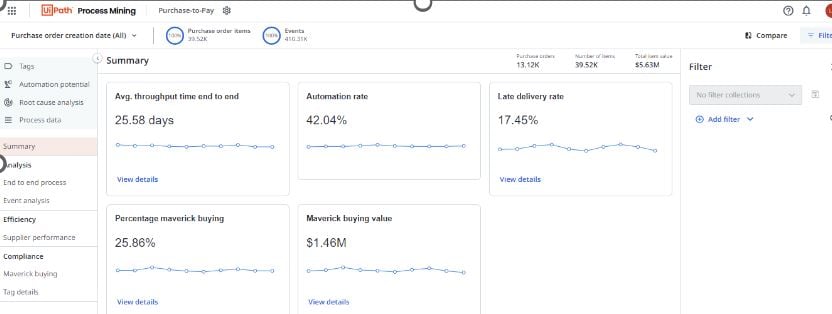
The screenshot shows that the UiPath Process Mining shows multiple dashboards such as tags, automation potential, root cause analysis, event analysis, and many more to visualize and analyze the process.
Step 1: Understand the dashboards
The dashboards on Process Mining showcase the process from different angles to get the best insights. The following are some of the standard and essential dashboards you need to know.
Summary Dashboard
The dashboards can be customized based on the process and the requirements. However, the summary generally shows a high-level view of the process, including all items processed, total events, total values, and other parameters for the period.
Automation Potential
The dashboard illustrates the cost involved with each process activity and its automation potential. This dashboard can identify which activities have a higher cost, which activities are already automated, and how the process has evolved with automation over time.
Root Cause Analysis
This is one of the compliance dashboards that UiPath Process Mining offers to find connections and correlations between events that took place.
Step 2: Identify process bottlenecks UiPath Process Mining visually represents the end-to-end process flow, highlighting the main events with its throughput time. The throughput time refers to the time taken to complete a task from beginning to end. The following diagram is an example of showing the throughput time of events occurred within a process.
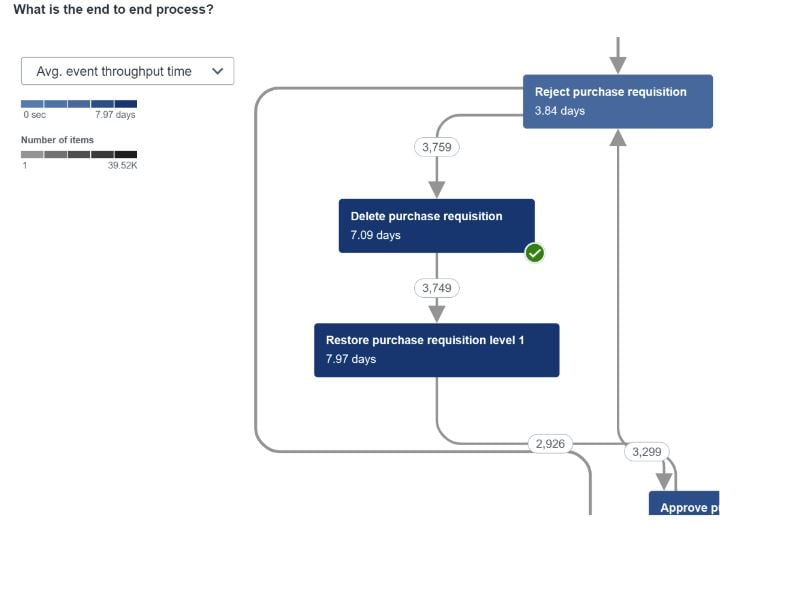
As shown in the sample diagram, the process flow shows the throughput time for each processing event. This information helps identify events that take more time than the benchmark. In addition, the flow diagram also represents repetitions of events if they exist. This analysis helps data analysts dig deep into identifying the root causes of the bottlenecks in those identified events.
The analysts can use other parameters to filter and analyze what other activities, users, and departments contribute to the delays in those identified events. The information gathered through these steps can be used to optimize the process by removing unwanted and redundant steps and applying lean to standardize and streamline the steps. In addition, analysts can cross-check the steps against the automation potential. The Automation Potential dashboard illustrates the current automation rate of activities along with activity cost and FTPs involved.
The Automation Potential dashboard allows users to simulate what they can achieve by introducing automation to the selected activity. In scenarios where bottlenecks are identified, the organization can apply standardization steps and analyze how they can improve the process. Applying automation to a standardized process could be the next step. The automation potential dashboard can simulate these steps to see how they can reduce the cost and improve the efficiency of the step by applying automation.
Conclusion
Process discovery is not always about analyzing selected business flows to automate. Organizations have hundreds of processes, and users may not know all the details. Many of these processes were created during the initial stages and may not have been revisited to improve. Process mining is one method that could use the digital footprints of applications to analyze and identify areas of improvement. UiPath Process Mining provides state-of-the-art capabilities to identify process bottlenecks and capture detailed information through easy-to-understand customizable dashboards.
Topics:
Process Mining
Country Director, Boundaryless Group
Related articles


Get articles from automation experts in your inbox
Sign up today and we'll email you the newest articles every week.
Thank you for subscribing!
Thank you for subscribing! Each week, we'll send the best automation blog posts straight to your inbox.
Get articles from automation experts in your inbox
Sign up today and we'll email you the newest articles every week.
Thank you for subscribing!
Thank you for subscribing! Each week, we'll send the best automation blog posts straight to your inbox.