
UiPath Orchestrator performance testing with K6

Summarize:
Introduction
To guarantee optimal performance for UiPath Orchestrator, we use K6 to create our performance tests. Performance assessment for Orchestrator service includes areas such as:
API User Interface-based tests — Performance tests that simulate multiple users in Orchestrator UI with a lot of static data already present in Orchestrator.
Robots based tests — Performance tests that simulate multiple robots connected to Orchestrator and running jobs.
In this article, we will focus on performance testing specifically tailored for Attended Robots.
Goal
Our objective is to guarantee seamless and swift communication between robots and Orchestrator. To achieve this, it was essential to implement comprehensive end-to-end tests covering the entire workflow of the robots, encompassing all the APIs used in robot-Orchestrator communication.
The Attended Robots performance tests are designed with several key objectives in mind:
Find bugs, of course.
Guarantee that there is no regression.
Minimize resource usage.
Determine the necessary Orchestrator infrastructure needed to support a certain number of robots.
Why K6?
K6 is an open-source performance testing tool developed by Grafana. The K6 engine is developed in GO and the tests are written in JavaScript. Typescript can be used to write tests and then transpiled in the traditional way—leveraging Webpack and Babel.
Some of the advantages for which we chose K6:
Tests as code—provides more flexibility.
Reusable modules that can be used across multiple tests.
Source control and code review are easier compared to other tools.
Better integration with CI/CD Pipelines.
From JMeter to K6
Since we started the Orchestrator performance tests, we used JMeter for writing our tests. However, we recently migrated to K6. Here are some of the reasons:
1. Code review
With JMeter, reviewing tests was challenging due to the XML format, making it nearly impossible without opening the UI. Because K6's tests are written in JavaScript, the code review is very straightforward. It improved collaboration and feedback across teams.
2. Test as code
JMeter relies on a UI for test creation, where test steps are added in a sequential order. K6 tests are written in JavaScript, but TypeScript can be used, providing more flexibility and taking advantage of Object-Oriented Programming (OOP).
3. Reusable modules (functions)
JMeter provides a mechanism for reusability through "Test Fragments," but they are limited to the same JMX file. In K6, creating modules for reuse across multiple tests is straightforward. Using a single module for all tests in k6 minimizes errors, providing a more efficient and maintainable solution compared to having identical code scattered across multiple JMX files.
What we learned during the tests migration
Script organization—The implementation of a clear folder and file structure has enhanced the maintainability of tests and made the development process easier. Additionally, implementing a modular design facilitated code reuse, further simplifying development efforts.
Interfaces—the test framework was written in TypeScript using the k6-typescript-template, allowing us to take advantage of interfaces and type inference. We used NSwag for Swagger-generated interfaces, minimizing the potential for errors in test development. This approach also aids in detecting potential breaking changes at an early stage in the development cycle.
Custom metrics—provide rapid feedback on APIs, offering a valuable tool for quick assessment.
Thresholds - are beneficial when executing tests within CI/CD pipelines, contributing to effective monitoring and evaluation.
Logging and error handling—We created custom logging to enhance the ability to debug potential errors that may occur during test runs. A strong error-handling mechanism is also important in identifying and resolving errors.
In summary, while the learning curve may initially appear steeper in K6 compared to JMeter due to the absence of the GUI, once the framework is established, adding tests becomes more straightforward and offers increased flexibility.
Implementation
We needed to make sure that our tests covered the entire robot workflow with the following actions and details:
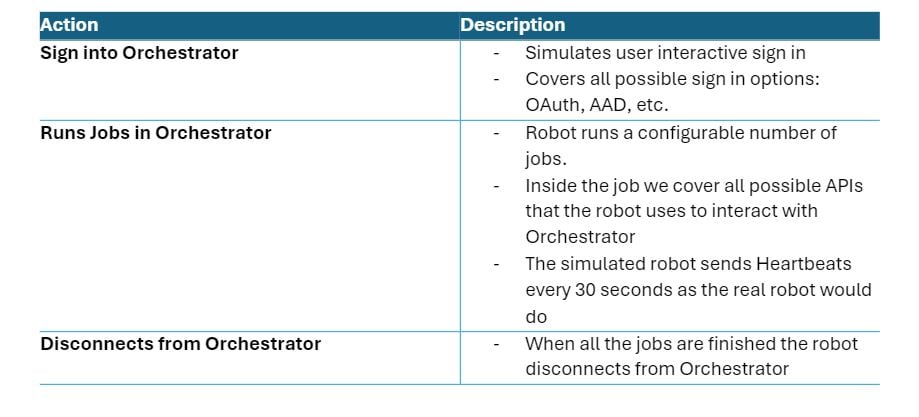
The K6 test lifecycle consists of four stages: initial context, setup, default and teardown functions, each serving distinct purposes within our testing framework:
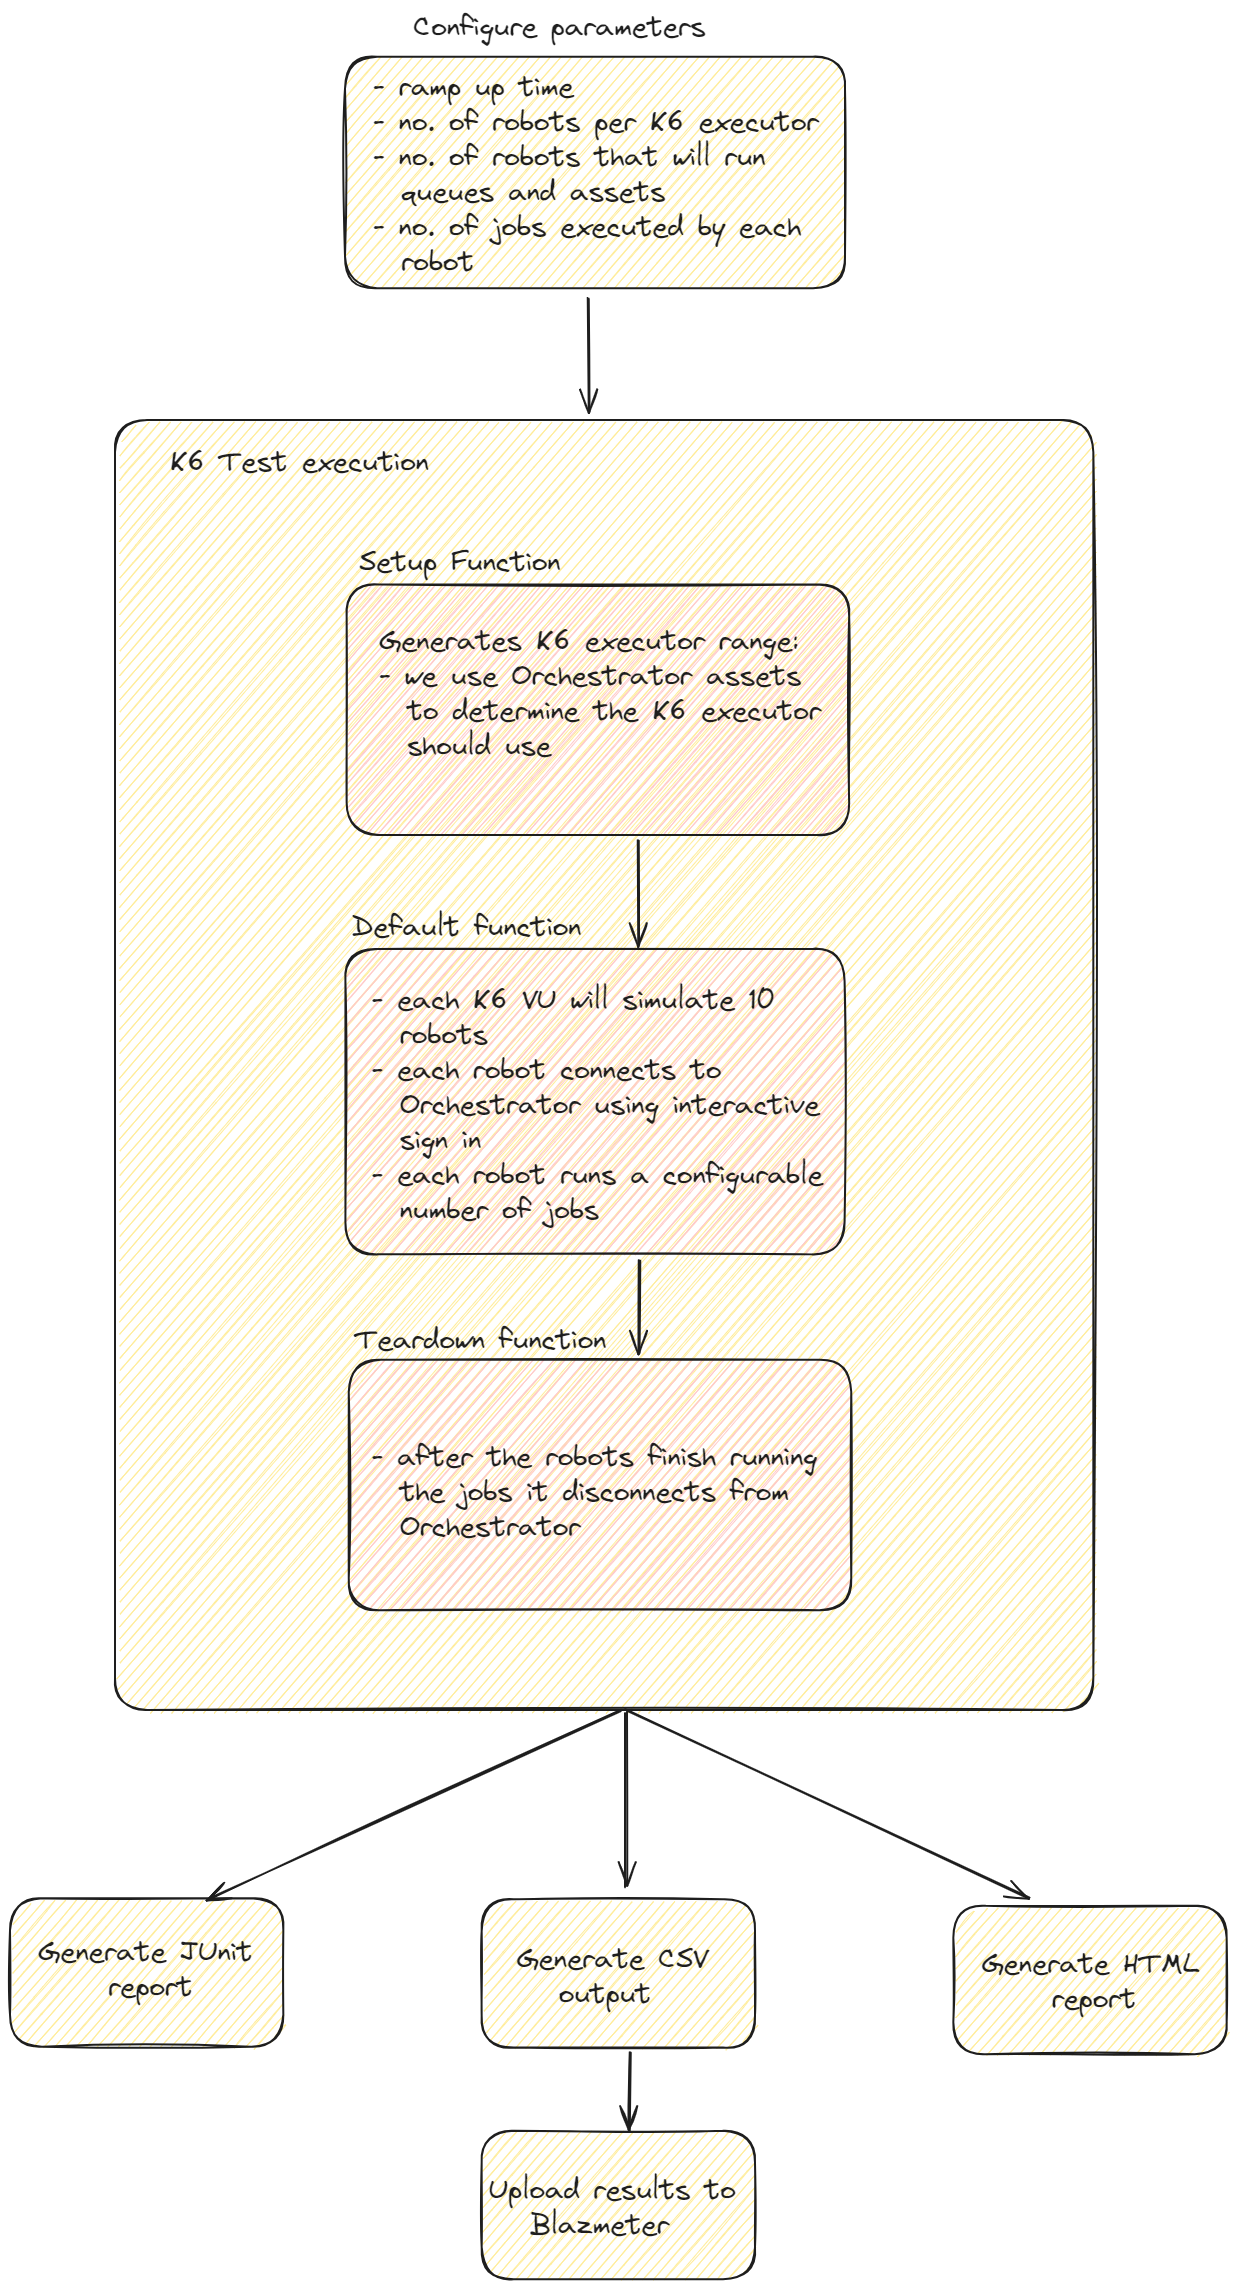
1. Initial context—the place where we configure the necessary parameters for our test:
Ramp-up time represents the time in which all the robots will connect to Orchestrator.
Number of robots that will connect to Orchestrator per K6 executor.
Percentage of robots that will execute queues and assets APIs. There are tests where we want just part of the robots to execute workflows that contain queues and assets.
Number of jobs executed by each robot. With this parameter we also control the tests length.
2. Setup function—it is executed once per K6 executor. We use this function to implement a dispatching algorithm that allocates specific robot ranges for K6 executor, when running the tests on multiple client agents. The robot users are provisioned with numeric naming conventions so each k6 agent can target its own robot range. We use Orchestrator assets to implement the synchronization algorithm.
3. Default function—runs for each VU (Virtual Users -execution thread) as many times as it was configured. This section represents the robot workflow:
Each VU handles up to 10 robot contexts, optimizing memory usage for K6 executors and enabling efficient resource use on client agents.
Each robot will connect to Orchestrator using an interactive sign in
Robots execute a configured number of jobs, with each job involving calls to various Orchestrator APIs, simulating a typical workflow. In this section, we control the throughput for each API by configuring the workflow for different scenarios. E.g. if we want to test queues more intensively, we add more queues APIs in the robot workflow.
4. Teardown function—when all jobs are finished, the robot disconnects from Orchestrator.
Running the tests
To achieve performance testing for many robots (>100k robots), we require distributed test runs:
Azure Kubernetes Service (AKS) with K6 operator - Leverages AKS to orchestrate the deployment and execution of K6 scripts using the K6 operator.
Ubuntu VMs — we use PowerShell scripts for deployment, execution, and data collection on each Ubuntu VM.
The tests target various infrastructure environments such as IaaS, PaaS, in Cloud, or on Automation Suite.
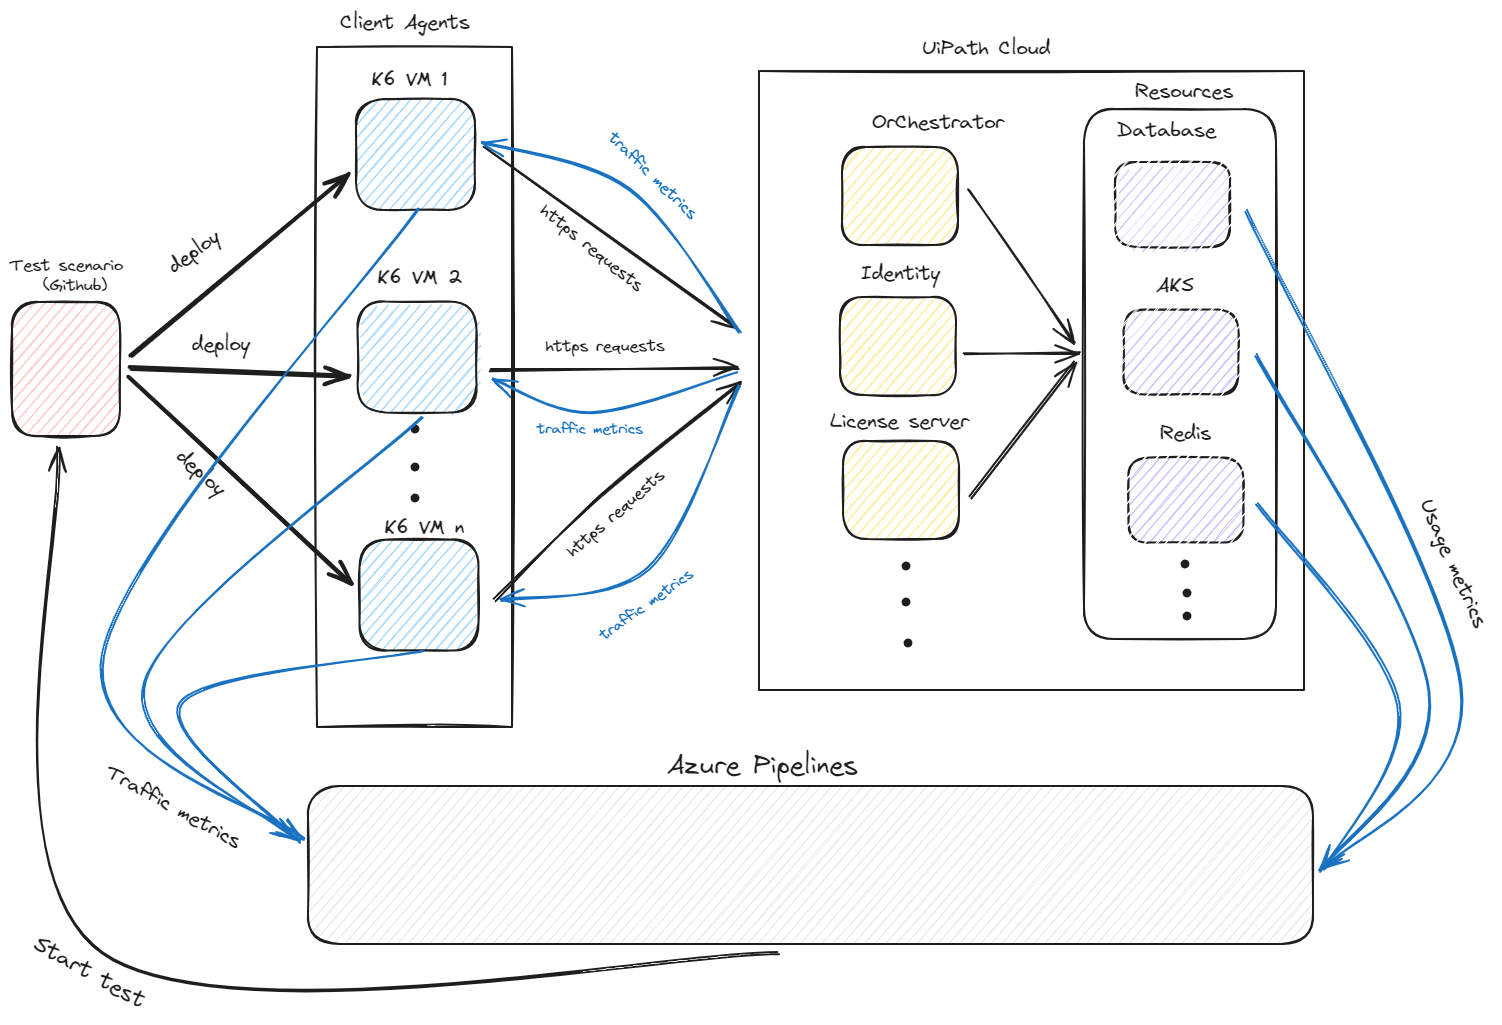
To automate the entire test run, we use Azure Pipelines. The Azure agents are only used for running the scripts that distribute and trigger tests and then collect test outputs, not to generate simulated traffic.
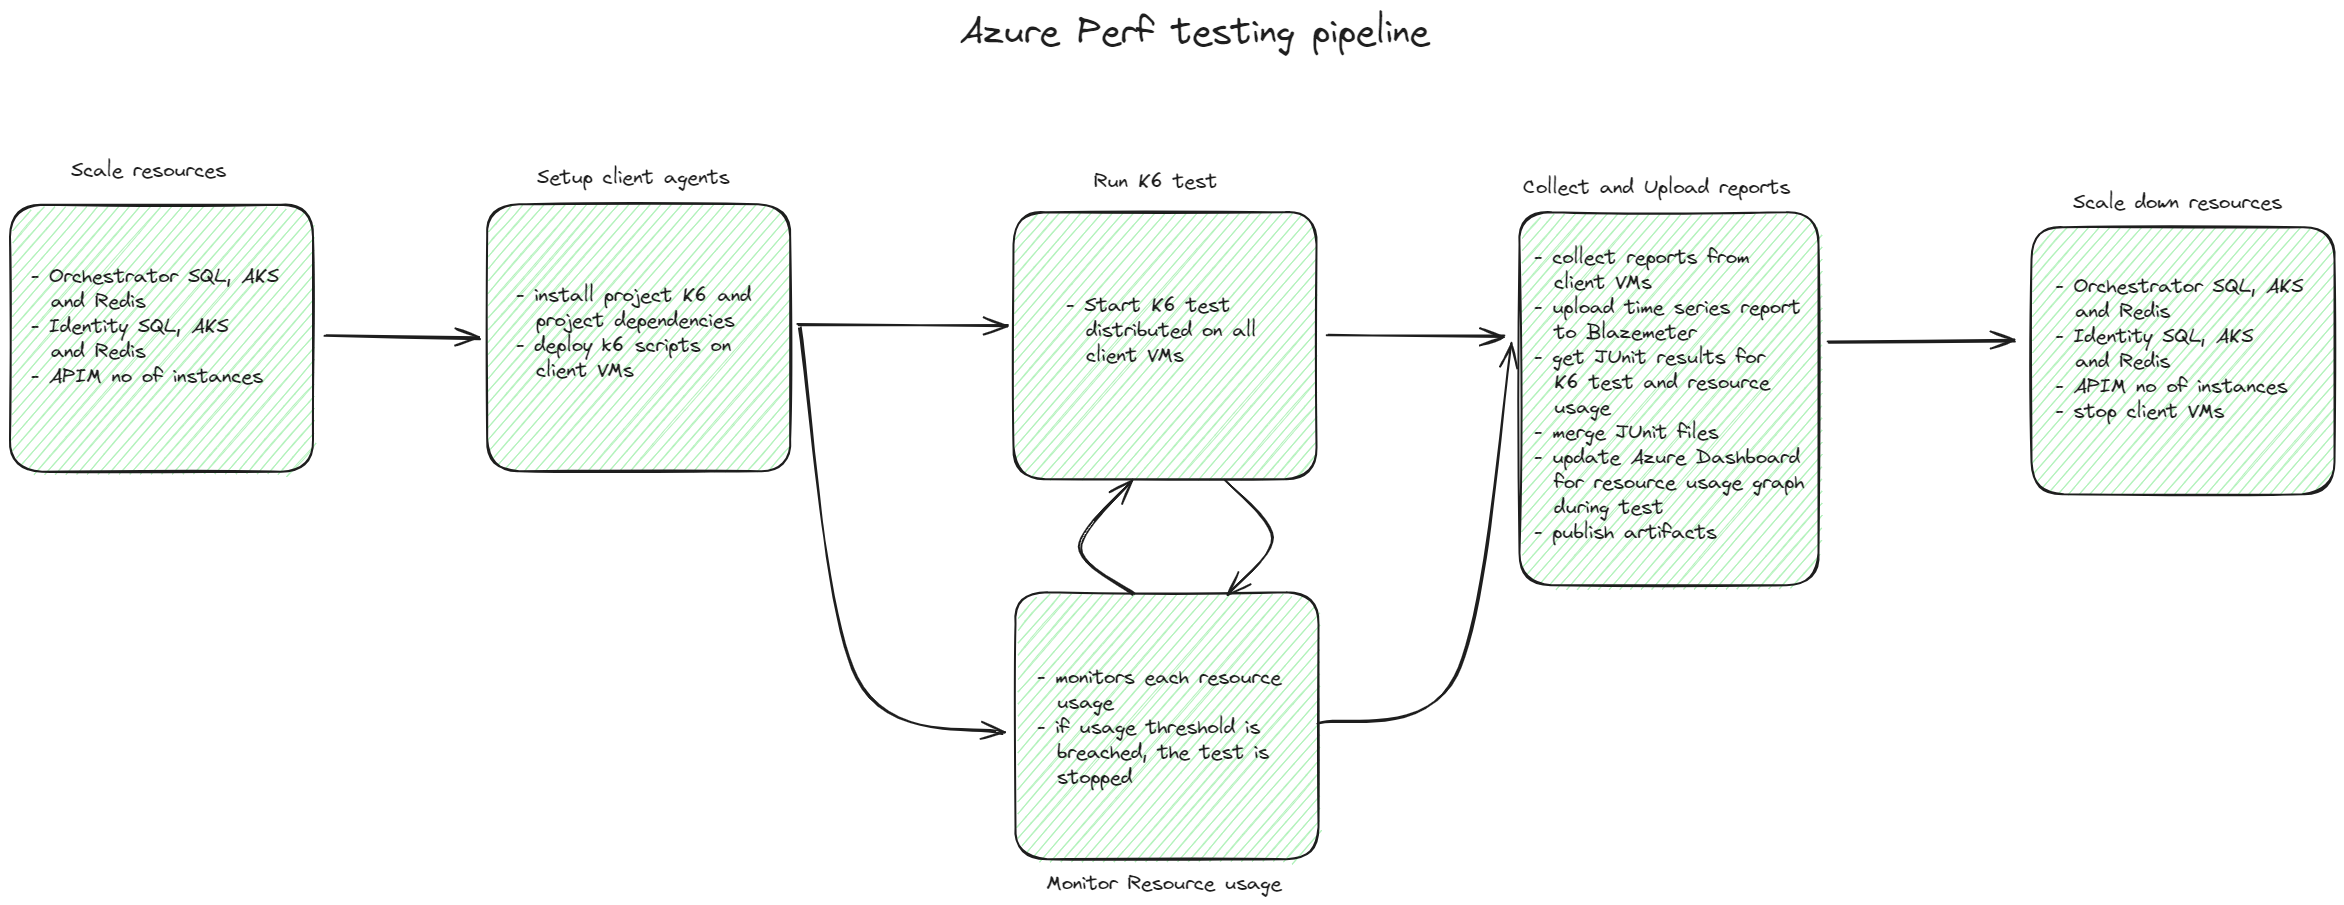
As it can be observed in the above image, the pipeline is responsible for the following:
Scale up and down all necessary resources for the performance test.
Deploys the K6 test script onto the client VMs, setting the stage for test execution.
Initiates the execution of tests on the client VMs.
A stage runs in parallel with the test that checks each resource usage against a predefined threshold. In case the usage increases above the threshold, the tests are stopped and failed, thus preventing the test environment environment potential crash.
Collects all the test output data from the agents, merges, and uploads the results.
Reporting
We collect multiple data outputs about the test run:
1. Client side
JUnit reports — used for pass/fail criteria. We define in K6 configurable thresholds for the test such as: avg response time, P90, P95, etc.
HTML reports – used for quick and convenient review of the test result.
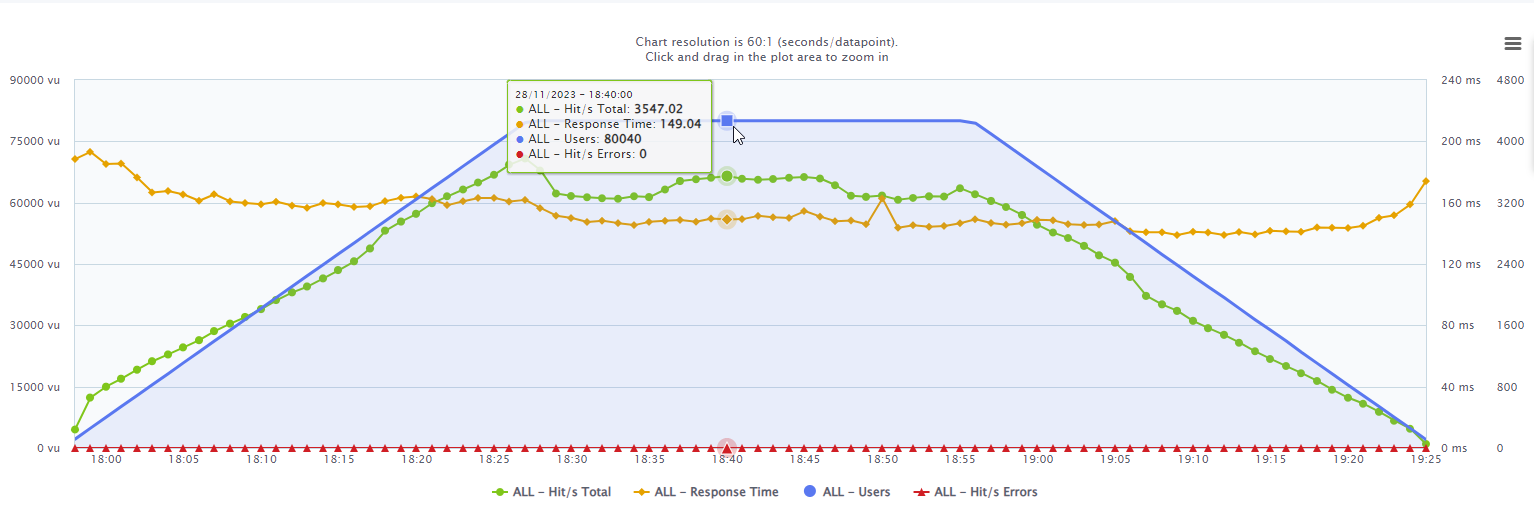
Blazemeter portal is used for time-series results, allowing extensive analysis of the data. API request stats table is available for performance metrics such as throughput, response time, bandwidth, and errors.
File logs — we developed custom logging in K6 that helps us identify any issues or errors during testing.
2. Server side
JUnit results - used for pass/fail criteria. Data collection includes average resource usage during testing, which is then compared to a predefined baseline for assessment.
Azure dashboards—the pipeline outputs a JSON file that can be uploaded to Azure to analyze each resource usage during the test.
Azure App insights – used for in APIs in depth analysis.
What is next
The current test architecture is scalable, so we hope to support more and more robots. We are also continuously working on improving all the tests and increasing the Orchestrator API coverage.
Topics:
Orchestrator
Senior Software Engineer in Test, UiPath
Related articles


Get articles from automation experts in your inbox
Sign up today and we'll email you the newest articles every week.
Thank you for subscribing!
Thank you for subscribing! Each week, we'll send the best automation blog posts straight to your inbox.
Get articles from automation experts in your inbox
Sign up today and we'll email you the newest articles every week.
Thank you for subscribing!
Thank you for subscribing! Each week, we'll send the best automation blog posts straight to your inbox.