
Reporting and Analysts 104: Measuring Attended Automations
Share at:

Introduction
Welcome back to my educational blog series about reporting and analytics at UiPath. We’ve done a ton of work in the analytics space since then, most notedly launching our analytics product, UiPath Insights! I got to lead and launch both the cloud and on-premises versions of the product, and it’s been one of the most rewarding endeavors of my career so far. I’ve watched as analytics has become increasingly important in robotic process automation, to the point that it’s now a critical tool leveraged by our customers when validating their investment in automation and building business cases for continued expansion.
Here’s the tricky thing about figuring out the value of your automation program — robots don’t speak. Unlike your human teammates, they can’t check with the IT team to figure out when the roadblock they’ve hit will be resolved or assess whether timelines will be impacted. They can’t present a business case for why using one application vs another will improve compliance. And most importantly, they can’t tell you about how they’ve driven efficiency in your processes and how much time and money they’ve saved. This is the exact pitfall that everyone experiences when they haven’t thought about automation analytics—how do you convince your executive-level stakeholders that continuing to invest limited and often tightly-held company resources on automation is important when you literally can't ask your robots what they’ve done and what impact they’ve had?
Measuring attended automations
There are two types of questions that everyone wants to answer when evaluating their RPA program:
1. Operational-type questions (aka what did the robots do [or not do]) like: how many hours a day are the robots working/being used? Do we have three robots free on Fridays at 4:00 pm so that we can run our "IT Resource Cleanup" bot at the end of every week?
2. Business-type questions like: what is the ROI of my automation program? How much time has our HR Onboarding Robot saved us this quarter? How much did I improve customer satisfaction with the increased efficiency that RPA has brought to my processes?
Don’t worry, I come bearing good news. While robots may not speak written language, they do speak in data. Data, if organized and tracked correctly, can answer every question that you or your executive stakeholders have about RPA and why you should keep using it. Here's some even better news: the product that I mentioned earlier, Insights, is designed to help answer operational and business questions a whole lot easier. This applies whether you have a couple of robots, a couple thousand robots, or even humans working alongside robots via automated automation to speed up their everyday tasks.
Since attended automation is such a new concept to so many people, there’s a lot of uncertainty as to what kinds of questions to even ask when trying to measure success. We recently launched a new dashboard template in Cloud Insights that helps you get started with attended analytics, focusing on the key metrics that'll help you understand usage and engagement. I’ll walk you through widget by widget (and don’t worry, on-premises users, this template will be part of our 2022.10 release!).
measuring-attended-automationThis dashboard is a lot more than just some pretty charts and colors. Before we dive in, there are three probable statuses that you may find your attended program in:
1. Everything is going great in your attended automation universe
2. Your citizen developers need a bit of a helping hand, likely in the form of some more training
3. Things might not be going so great
This dashboard will help gauge where you stand and empower you to make data-based decisions to steer back to #1 if you’re not there right now. Let’s dive in and start from the top left corner.
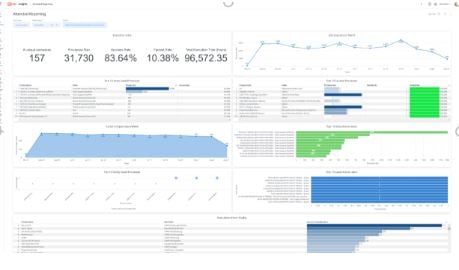
1. Execution data
1.1 # of unique processes — Every automation has a name, right? Here we count the number of names that have been run by attended robots on this tenant. This tells you how many different types of work your developers have tried to automate. Disclaimer, this number can vary a lot depending on how many developers you have. You can create your own multiples here, but that’s my general guideline for a small program.
1.2 Success rate
Obviously, you hope that every automation is going to run without any issues. Realistically, that won’t happen. It’s very important to keep an eye on just how many automations are finishing without a problem, aka successfully. This is sometimes a trick metric in the sense that you think you want this to be 100%. You don’t. Surprised? Robots are going to run into things beyond their control like network outages, applications being down for maintenance, computers freezing or auto-restarting because of upgrades, etc. Those unexpected and uncontrollable events could make it impossible for a robot to be successful 100% of the time. The biggest concern for attended automation is none of the above—it's that the developers who built the processes might not have been able to account for known and expected error situations appropriately. This will manifest in an automation that finishes successfully but didn’t do anything. If you see a 100% success rate for all automations, this should be your red flag. Don’t let this go. Do a deep dive into the workflow code and make sure that it’s handling errors correctly.
1.3 Faulted rate
Very similar in principle to my explanation for success rate, except for the opposite outcome. This measures just how often your automations aren't completing successfully. Some faults are good! No faults raise the same red flag as 100% success. In most cases its either the developers are having trouble getting the robots to do what they want them to do, or the process set that they’ve picked out is too complex for the attended use case.
1.4 Total execution time (hours)
This tracks how long the automations are running. You should look at it in combination with the metrics explained above. High usage with high faults means that your developers need help because they’re spending a lot of time trying (and not being successful) in getting the automation to work. High usage with low faults means your team is getting the hang of things and they’re making good use of their robots! Low usage means it’s just not sticking with them — either they’re not sure how to use the robot or they don’t want to. This is a great indicator for understanding the operational maturity of your RPA program.
2. Job executions trend
This one tracks how many times per week automations have been run. It’s natural to find peaks and lows for some weeks here and there, but a steady downward weekly trend is a sign that usage is dropping off. If you’re seeing this happen, it’s time for an investigation into why. It goes without saying that positively trending usage is great news.
3. Top ten most used processes
These are your top automations! It’s a list of the ten most —literally — useful processes, which likely means that the folks who built them are really getting the development thing down. However, these might also be the processes that people keep running, and re-running, trying to figure out why they’re not working. The success rate should give you a view into this.
4. Top 10 faulted processes
Ideally, these won’t overlap with the list of the top 10 most used. The processes here follow the common theme that I keep touching on: the developers who built these processes probably need a helping hand. They’re struggling with some aspect of getting the robot to click the right thing, send the right email, etc. These processes could be a bit more complex and might require a more experienced developer to look into them, or they might not be good candidates for automation at all.
5. Active unique users per week
Do you know how many licenses you bought? If you don’t, make sure to check. Now compare this number of licenses to how many unique users you have per week. If the number is close to equal, it means everyone who you gave a license to has tried to use the software at least once that week. If that number starts to lag for a few weeks, it means that some intervention is needed. Nine times out of ten, the people who have the licenses haven’t reached a level of basic competence and are overwhelmed. They just need a helping hand to show them how to use the tools at their disposal.
6. Top 10 most active users
A literal list of your automation rockstars! This group of people are constantly making use of the licenses you’ve given them and are likely to be great tutoring candidates for other users who are struggling. Not to be a bummer, but don’t forget about the faulted problem—make sure that the users on this list aren’t spending this time running automations endlessly because they can’t figure out how to get them right. On the off chance that’s true, don’t lose hope! They’re clearly trying to get it to work for a reason, and it’s because they believe in the value that it brings. Pair them with someone else on the list who isn’t experiencing the faulted problem and they should be experts in no time!
7. Top 10 rarely used processes
There are plenty of explanations for why a process might not be used a lot—for example, it might be related to a critical business process that's closely tied to a specific time of the year. If you look at a tax-related process, you’ll see low or no usage for that process during the months when no tax action is needed. You know your business scenarios better than we do, so just keep those kinds of caveats in mind when looking at these processes. Generally speaking, however, this is likely a list of automations that just aren’t working out. That could be for a few reasons that include a lack of awareness of their existence (on the most positive side of the spectrum), they’re relevant to a very small subset of people, or they don’t work (on the most negative side).
8. Top ten least active users
The first 10 users you should approach for feedback. Either they don’t see the value of automation, they don’t know how to use it, or it’s really not relevant to them and you should redistribute the license to someone else who’ll make better use of it.
9. Executions from Studio
Okay, this one is a real pet peeve for many "Attended Automation Program" leads. Studio (aka where the development is done) is supposed to be used for development. Period. When an automation is ready for the limelight, it should be run from the Assistant, which is literally built to make everyone’s life easier when it comes to running automations. The tricky part here is that it’s very hard to track who’s doing this unless you’re privy to a secret. Lucky for you, I’m sharing it with you. You won’t see records of these runs in Orchestrator. It’s by design because you shouldn’t – again, because automations run from Studio should be for testing purposes. Our saving grace here is that if the Studio is connected to Orchestrator (which in cloud scenarios it pretty much has to be), the development robot that executes the Studio automation still generates logs that get sent to Insights.
So how do you differentiate these logs from logs that are part of an automation that was correctly kicked off? Easy. We set a filter on this widget to show logs that don’t have an associated job in Orchestrator. And that’s it! Find the users that are running their automations from Studio en-masse and make sure they understand how to use the Assistant! Otherwise, you’re not going to be able to track a lot of great information that you’d get if they were running the automations correctly. Pro tip: some of our customers set policies via UiPath Automation Ops to limit runs from Studio to a certain low number. This acts as a forcing function to ensure a process must be published to Orchestrator and run via Assistant.
Conclusion
What a list, right? All of these widgets are designed to help you figure out what’s going well with your attended automation and/or the citizen developer program and what isn’t. Don't panic if you don’t immediately see the results that you were hoping for. Most problems that you’ll discover can be easily fixed by using the "Attended Reporting" template to track, measure, and guide adjustments to your automation and program approach.
Alright! We covered some pretty important operational metrics for attended automation. Once you get your team using the product effectively, it’s going to bring some pretty clear benefits to your business! How do you measure those? We’re constantly working on new templates to help jumpstart your reporting, and ROI from attended automation is high on our list. Stay tuned for my next blog post and more Insights dashboard templates. 😉 Until then.
Topics:
RPA
(Previously) Principal Product Manager, UiPath
Related articles


Get articles from automation experts in your inbox
SubscribeGet articles from automation experts in your inbox
Sign up today and we'll email you the newest articles every week.
Thank you for subscribing!
Thank you for subscribing! Each week, we'll send the best automation blog posts straight to your inbox.