UiPath Insights: Analytics Beyond the Bot

Summarize:
Editor's note: This is the fourth post in a series of blog posts on analytics. To start at the beginning of the series read RPA Reporting and Analytics 101: Introduction to Logging.
Welcome back! It’s been a while since my last post, but I promise that I used the last few months off from blogging to do some important things. Given my love of analytics, I was given the incredible opportunity to lead the charge on our new analytics product, Insights. I have a lot to say about Insights and what it means for UiPath, but I want to focus on what this new product means for you.
Before we go into details, I want to invite you to join me for the Product Spotlight: Maximize the Value of Your Automations with UiPath Insights webinar. Webinar registrants will also get exclusive early access to our new RPA Analytics white paper!
(If you're reading this after January 29, 2020 don't worry! The on-demand webinar will be available for you to watch.)
If you remember my last three posts, I explained the pros and cons of using the UiPath Orchestrator SQL database as a reporting source, why custom logs and Elasticsearch/Kibana go hand in hand, and why queues are your #1 resource when it comes to transactional data and business outcomes. I also briefly touched on the lack of solutions for combining your operational data (SQL) with your business data (logs); you had to make the choice to exclude some of your data depending on what business intelligence (BI) tool you chose.
Over the last few years, in general, Robotic Process Automation (RPA) specific analytics has been thoroughly underserved. Analytics have either not been included in many RPA solutions, or (even when popular RPA vendors claim to have analytics covered) the solutions provided have been very limited and/or complex.
Everyone was focused on identifying RPA use cases, picking the right vendor, and getting a team trained and ready to implement. After a certain point, everyone got to the “ah-hah” moment when they realized they couldn’t move any further in their RPA journey without understanding how their robots were performing and what business impact that performance had. And admittedly, we didn’t have a great solution for this either.
When using SQL, you sacrificed easily visualizing the custom data in your logs. When using Elasticsearch and Kibana, you had free-for-all log access, but no way to access a lot of really important operational data held in SQL (like robot type, job status, etc).
We recognized that problem, and it was our most important driver in creating the best-in-class analytics product that lets you have the best of both worlds.
Yes, that’s right. You can access BOTH custom logs AND operational SQL data in UiPath Insights.
You shouldn’t have to abandon any information when it comes to knowing how your bots and your business are doing.
While I was in the field as an RPA developer, I heard a lot of other customer complaints that drove how we designed this product. Let’s go through the most common ones:
Why do I have to go through a totally separate interface and product just to see how my robots are doing?
We agree, that’s frustrating! And starting now, you don’t have to. Insights is integrated directly into Orchestrator, and it can be turned on or off per your specific tenant.
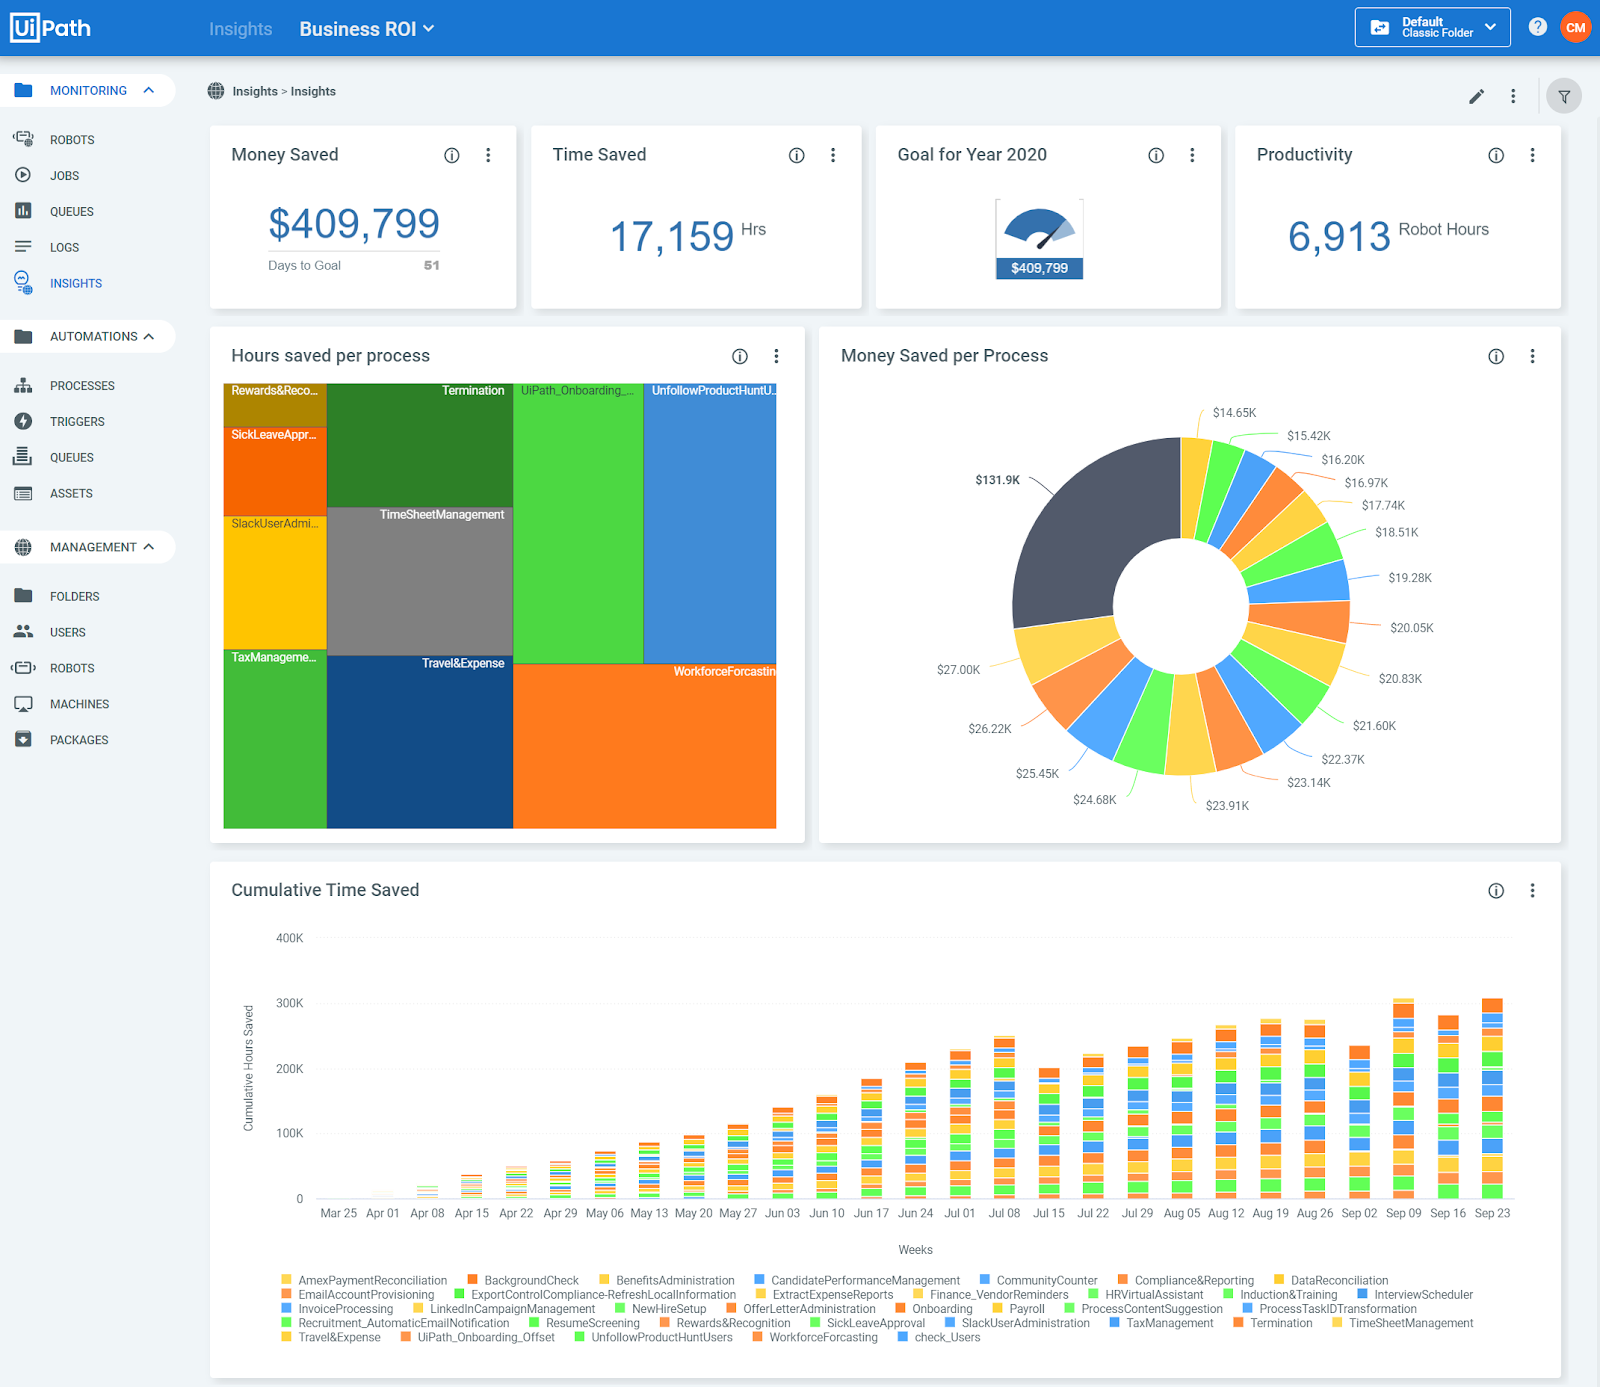
I want to see my time and money (ROI) savings, but there aren’t any UiPath dashboards for this.
Done. We made one for you and provided it as one of the four out-of-the-box dashboards available to you as soon as you install Insights. It is totally customizable, so you can set savings goals for your business, change any of our ROI calculation formulas, and even forecast time savings! We’ll come back to forecasting, you’re going to want to leverage that as much as you can.
It’s difficult for our business users to make great-looking and informative visualizations quickly.
100%. It’s unreasonable to ask someone that doesn’t know how to program to interact with a tool that requires a lot of technical knowledge. With Insights, it’s easier than ever to create clear and concise dashboards. You can make a pie chart that shows the number of process runs per robot in eight clicks. That’s right, I just tried myself and counted. You can now have a whole new user base creating dashboards specific to their process without the headache of writing complicated queries.
UiPath Orchestrator upgrades tend to involve some schema changes and my Tableau/Power BI dashboards get broken.
Not anymore! We will manage all of this for you. Any time Orchestrator has a change, Insights will take care of it. You shouldn’t notice any difference in your experience.
I want to have alerting on key values like success percentage, but most BI tools don’t have it built in.
We know it’s important to stay up-to-date on key performance indicators (KPIs), and it’s annoying to have to check a dashboard every time you want to see how something is doing. Insights has an integrated alerting mechanism called Pulse. With Pulse, you can set three types of alerts:
1. Threshold – i.e. send me an alert when my metric is greater than, less than, equal to, etc.
2. Automatic – Anomaly detection! Hooray! Don’t worry about setting a threshold, our machine learning algorithm will figure out when data points don’t make sense and let you know.
3. Always – When you want an alert every 15 minutes, regardless of if the value you want to watch hasn’t changed, this is your guy! Use sparingly; it might seem great at first, but a Slack message every 15 minutes can easily get overwhelming. Sometimes though, you’ve just got to use it.
I want to connect to SQL for reporting, but I have a lot of data and my dashboards are SO slow.
Yeah, that tends to happen with SQL databases after a few million records. With Insights, we make use of columnar data cubes, meaning they store data by column instead of by row. TL;DR about columnar stores, they’re ideal for analytics because they optimize query performance and storage. We can scale up to 500 million records - yes, your eyes are not lying to you, I said 500 million. You’ll have to bump up your hardware and software to support that kind of load, but we’ve tested and it works just fine.
Monitoring doesn’t show anything past 24 hours. I want to see more data than that.
Let me be the first to say that Monitoring is one of the best additions we’ve made to Orchestrator. It occupies a very important space in the troubleshooting realm and is the perfect solution for RPA developers and IT/Center of Excellence (CoE) managers to keep an eye out for problems. Monitoring also does what Insights can’t – it provides real-time information. That is a ton of data to store, which is why Insights could not survive as a product past a few days worth of data if we used a real-time model. Insights is on a different mission: we set out to provide historical data so that you can view trends over time. Between our two products, you get everything you need to act quickly and adjust strategically.
There’s no way to edit and export dashboards from Orchestrator.
Well, there is now! With Insights, you have all of your operational data, plus any business data you’d like, to build the most wonderful dashboards your heart desires. All dashboards are exportable as PDFs, PNGs, and most widgets can be exported as a CSV file. All dashboards are also exportable as .dash files, which means you can always upload them onto another Orchestrator tenant (or even another Orchestrator!). You can also share dashboards with any other Insights users on your Orchestrator tenant. So, build away!
Designed to be customer-centric, we’ve included a few other bonus items that I think you’ll be really excited about:
Forecasting: Forecast key metrics like robot utilization, time and money saved, and more! Think capacity planning – this is your key to scaling! When your unattended robot utilization is hitting close to that 24-hour mark (perfect opportunity for a threshold alert), it’s time to redistribute your workload and add more robots. Use this to prevent automation backlogs and bottlenecks. With insights from Insights (see what I did there?), you don’t have to wait until something goes wrong to take action.
Rich charting library: Seventeen different widget types are at your disposal from the moment you go to build something new. You can find the right way to visualize any kind of data.
Automatic data import: With Insights, you don’t have to label any data specifically for analytics. Everything you need from Orchestrator is imported directly into your Insights database, and all your custom variables come with it!
Dynamic filters: Click a widget and it filters the rest of your dashboard. Edit your filter, run contains searches to match text in a result subset, filter by any field in the dataset, save a default filter for a dashboard, and more! You can easily split your data by business unit, making dashboards that appeal to everyone.
Are you as excited about Insights as I am? I hope so because this is only V1 and we’re just getting started. Our future roadmap is jam-packed with features and improvements to elevate your experience and unite your data.
We’re ready to evolve our product with you, so please try it outand share your thoughts! And most importantly, let us help you go beyond the bot and show you just how impactful RPA has been for your business.
Topics:
InsightsSenior Analytics Product Manager, UiPath
Related articles


Get articles from automation experts in your inbox
Sign up today and we'll email you the newest articles every week.
Thank you for subscribing!
Thank you for subscribing! Each week, we'll send the best automation blog posts straight to your inbox.
Get articles from automation experts in your inbox
Sign up today and we'll email you the newest articles every week.
Thank you for subscribing!
Thank you for subscribing! Each week, we'll send the best automation blog posts straight to your inbox.