Process Mining Demystified: Creating a Dashboard

Summarize:
This blog is the second in a series of blogs called Process Mining Demystified. Before reading this blog, we recommend reading the first blog on connecting and transforming data. After reading this blog, you’re ready to start analyzing your data.
Introduction
Process mining provides organizations with valuable insights into their business processes, enabling them to identify bottlenecks, optimize workflows, and improve overall efficiency. Of course, a significant part of achieving all of the above is the ability to model the visualizations and KPIs (key performance indicators) to your business needs.
UiPath Process Mining offers capabilities to create and customize your dashboards, charts, and metrics. This allows users to create valuable process insights and visualize process data through various charts and KPIs. In this blog post, we'll walk you through the process of creating a dashboard and adding charts and KPIs in UiPath Process Mining.
Starting to edit your process app
The first thing you need to do is create your process app. You can start by browsing through the out-of-the-box app templates that are available and play with sample data or bring your own data. See the first blog in this series-Process Mining Demystified: A Guide to Connecting and Transforming Your Data.
Once you have created your process app, you can start editing. Select your process app and click on the "edit application" button. Clicking on the “edit application” button will launch the App Editor, where you can customize your dashboards or create new ones.
Creating a new dashboard
Within the App Editor, click on the "Add New Dashboard" button to create a new dashboard. Give your dashboard a meaningful name that reflects its purpose or the specific business scenario it represents. For example, you could name it "Invoice Approvals" if you are creating a dashboard focusing on the approval part of your invoicing process. To rename it, right-click your dashboard and use the “rename” option.
You’ve created your dashboard, but it’s empty. The next step is to choose your dashboard layout. There are several layout options available out-of-the-box, depending on how many charts you want to have. There are eight layout options available, ranging from one chart to four charts.
Choosing your charts
With your layout selected, you can navigate between each chart placeholder section and the KPI bar at the top. If you want to choose a different layout, select the top KPI bar and the “Change layout” button available on the top of the right side-panel.
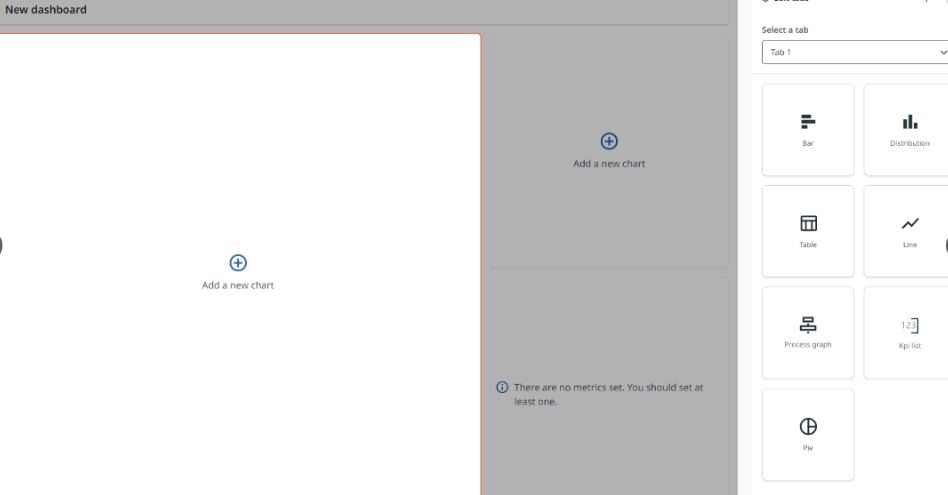
Selecting a chart placeholder allows you to choose the chart type you want to add from the side-panel. You can choose from the following available types:
Bar chart
Distribution chart
Table chart
Line chart
Process graph
KPI list
Pie chart
If you aren't familiar with some types of charts, we’ve got you covered with details about our charts.
Configure the chart properties
Once you've chosen a chart type, it's time to configure its properties. In the chart properties panel, there are three main sections that can be customized:
Edit tabs
This section allows you to create additional tabs within the chart placeholder and create new charts on each tab — this is a great option to have more charts on one dashboard if your use case requires it. Within this section you can also navigate through all existing tabs to make changes to the correct chart.
Edit chart
This section exposes the configurable properties of the chart, depending on the selected type. You can change the title of the chart, as well as the data that should be displayed on the chart. You can choose from the list of available fields and/or metrics within your data model. For example, a line chart will allow you to customize its title, choose the fields that'll be displayed on the X-axis of the chart and select the metrics shown on the Y-axis.
Once all properties of this section are filled in correctly, your chart should already display the data based on your choices. You can see the results when editing so changes can be made if required.
Add filters
The third and last section allows you to filter the data that should be displayed on the chart. By default, all data is used, but depending on the use case you might want to use parts of the data. For example, if you are building a dashboard for invoice approvals, you may want to filter on invoices that have already been approved.
To add a filter, you can just click on the dropdown menu or search for the field you want to filter on. Applying the filter happens instantly, so you can see the values on your chart changing based on your selection.
Add your KPIs
In addition to creating the charts, UiPath Process Mining allows you to add KPIs to your dashboard. KPIs provide a concise overview of important process metrics and enable you to monitor performance closely. To add a KPI, click on the top “KPI bar” and select from your available metrics in the dropdown menu.
Consider including relevant KPIs that align with your process improvement goals. For example, you could track average process duration, cycle time, or monetary value. The maximum number of KPIs you can add for one dashboard is five.
Preview and publish
Once you've added charts and KPIs to your dashboard, take a moment to preview your creation. The “Preview” action available on the top bar allows you to see how the dashboard will look and function when viewed by end-users. Make any necessary adjustments to ensure the dashboard provides the desired insights and visualizations.
When you are satisfied with the dashboard, click on the "Publish" button to make it available to other users in your organization. Published dashboards can be accessed by authorized individuals through the UiPath Process Mining web interface.
Conclusion
Creating a dashboard in UiPath Process Mining empowers you to unlock the full potential of your process data. With visualizations and KPIs tailored to your specific needs, you can gain valuable insights, make data-driven decisions, and drive continuous process improvement.
Remember to regularly review and update your dashboards as your processes evolve or new insights emerge. UiPath Process Mining offers a flexible and dynamic environment that allows you to adapt and optimize your dashboards as needed.
We hope this step-by-step guide has provided you with a solid foundation for creating your own dashboards in UiPath Process Mining. For more detailed instructions and advanced functionalities, refer to the official UiPath Process Mining documentation.
Happy dashboarding!
Topics:
Process Mining
Senior Product Manager, UiPath
Related articles


Get articles from automation experts in your inbox
Sign up today and we'll email you the newest articles every week.
Thank you for subscribing!
Thank you for subscribing! Each week, we'll send the best automation blog posts straight to your inbox.
Get articles from automation experts in your inbox
Sign up today and we'll email you the newest articles every week.
Thank you for subscribing!
Thank you for subscribing! Each week, we'll send the best automation blog posts straight to your inbox.