
Top 10 Examples of Successful Data Analysis

Summarize:
It is impossible to catalog and classify all examples of data analysis, let alone list them on an arbitrary scale of “greatness.” Data analysis isn’t one finite set of events with a beginning and an end. It is a way of looking at the world around us. Indeed, if the definition is taken to extremes, consciousness itself could be seen as data collection and analysis: with further collection and analysis being driven by insights of previous iterations.
Of course, this conscious loop has many branches. To map them all out would create an infinite recursive fractal, where each step is subject to further inspection, action, and change.
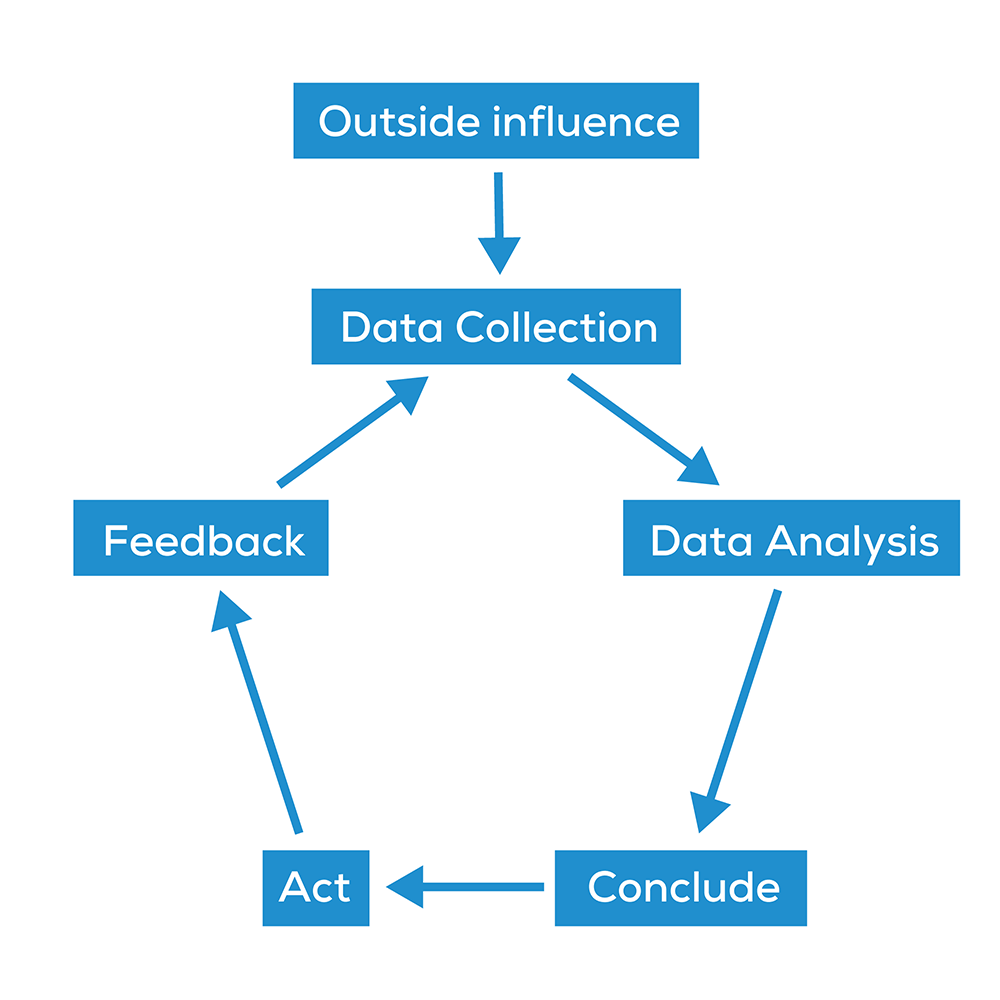
In the simplified, abstracted model of the conscious loop, the greatness of an analysis can only be considered in terms of its effects. The data analysis can be considered successful if:
The data collected is checked for quality
Analysis is done with rigor
Conclusions flow from the premises
Useful actions are taken (or able to be taken)
If any step is missing, the analysis itself falls apart.
With this in mind, I present ten of my favorite examples (throughout history) of successful data analysis.
My completely arbitrary choice of the prestigious first pick is the most successful example of data analysis (ever) in world history: the first demographic census.
1. Sumerian census
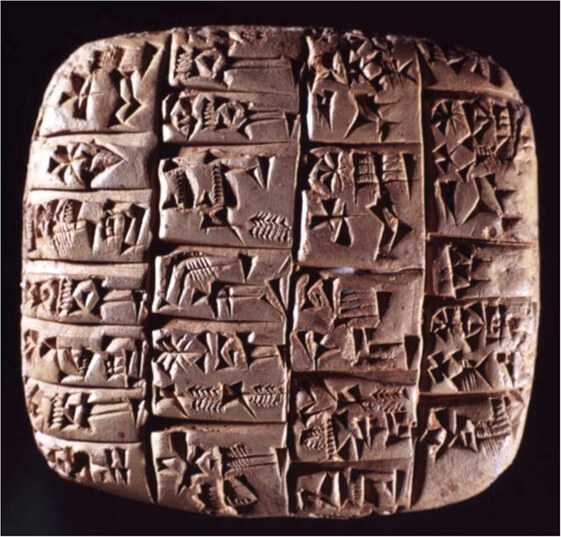
We will never know when or where the first person decided to record data about people or to what end. We do know it was useful because the idea lasted. Written records of data start with ancient records of trade, recorded on clay tablets about five thousand years ago.
The first time (that we know of) this kind of written data analysis had a disproportionate impact on many people at once was when the kingdom of Sumer (sometimes called Babylonia) started to record its population in order to distribute food stocks. Some of the tablets used for this census have survived to the present day and are on display at The British Museum.
There is still much we don’t know about Sumer, but we know they achieved success in architecture, engineering, mathematics, warfare, law, administration, and the earliest written language. How much of this can be attributed to their data collection and analysis, we will probably never know.
In time, census taking took hold in ancient Egypt, where it was used to calculate and organize the labor force. The book of Numbers in the Jewish Torah records census taking for military purposes, and the Romans started recording demographic data around 600BC.
The oldest surviving census data is from the Han dynasty in China during the second century, recording a population of 59.6 million. Ancient censuses and the analysis of their data were extraordinary social and organizational achievements, probably aiding many ancient rulers in the governance of their lands and peoples.
2. Florence Nightingale
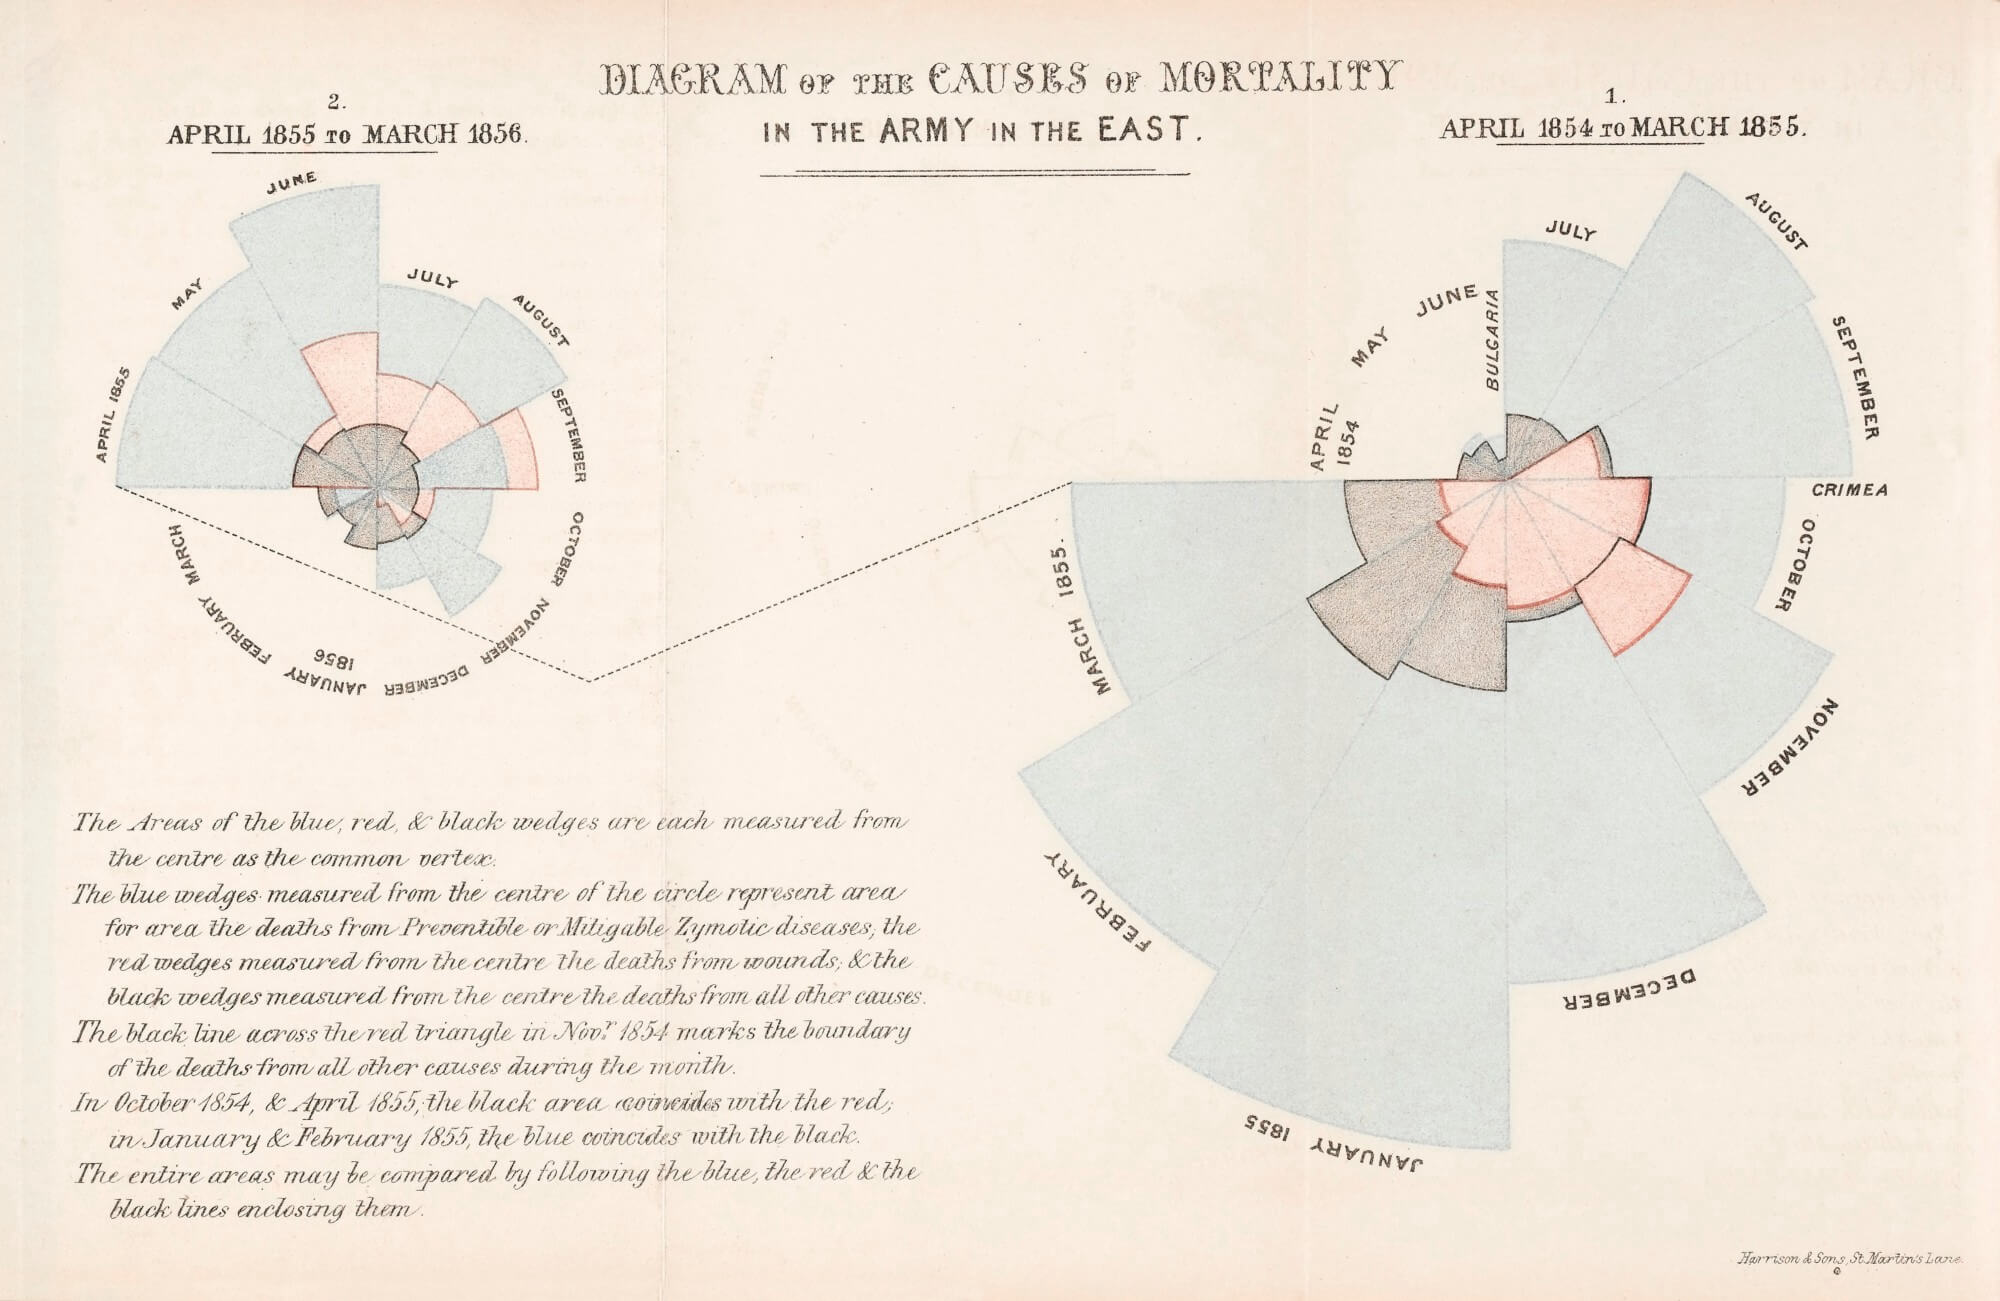
Florence Nightingale is most well known as a nurse, but she was also one of the first to use infographics to display the results of statistical analysis. According to Nightingale:
“Diagrams are of great utility for illustrating certain questions of vital statistics by conveying ideas of the subject through the eye, which cannot be so readily grasped when contained in figures.”
Nightingale used her statistics and connections with the ruling classes of Britain to fundamentally reform and modernize healthcare in the late nineteenth century by identifying sanitation and hygiene as critically important to health outcomes. She came to these conclusions through data collection and analysis. But her presentation of the imperial data was so iconic that the data had the ability to reach those with the powers to enact change (impacting healthcare practice forever).
3. John Snow
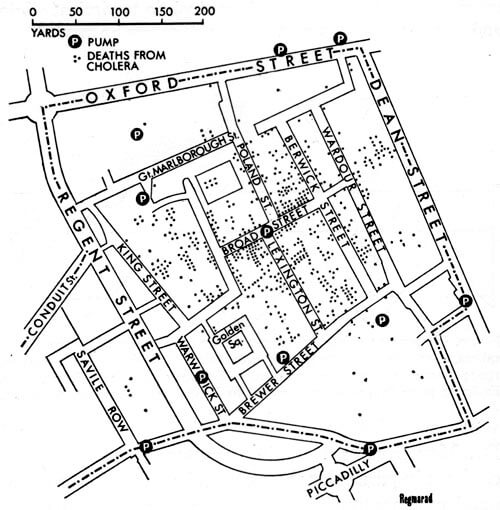
Dr. John Snow is another healthcare-related story that took place around the same time as Nightingale’s diagrams. Snow (not the Game of Thrones character) was a British doctor who used data collection and data analysis to trace the source of a cholera outbreak in central London. Through data analysis, he came to the conclusion that cholera was transmitted by “an agent in the water” than by the accepted theory that it was transmitted by “bad air.”
Snow used data collection to trace the cholera outbreak to two water companies who drew their water from the Thames river, virtually unfiltered. He wrote that a huge, double-blind experiment fell into his lap:
“No fewer than three hundred thousand people of both sexes, of every age and occupation, and of every rank and station, from gentlefolks down to the very poor, were divided into two groups without their choice, and, in most cases, without their knowledge; one group being supplied water containing the sewage of London, and amongst it, whatever might have come from the cholera patients, the other group having water quite free from such impurity.”
Snow’s analysis of the subsequent data and his other works led to fundamental changes in water and waste management in London and other cities, saving many lives and contributing significantly to global public health.
4. Abraham Wald
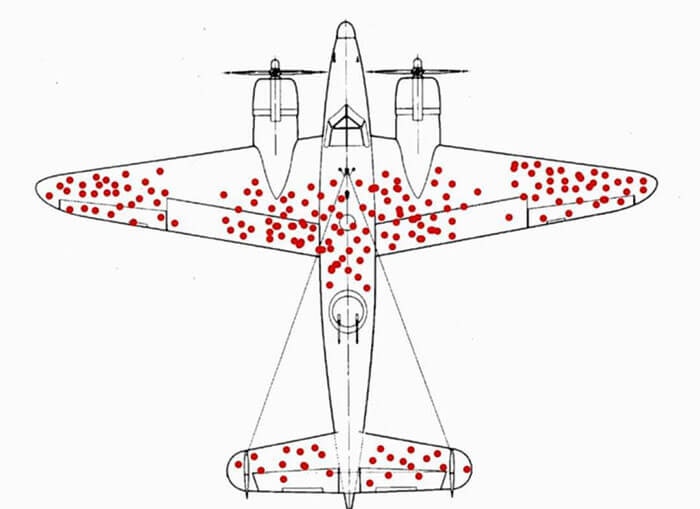
Abraham Wald was a Hungarian mathematician who worked for the United States (U.S.) during World War Two.
His contribution to this list of great data analysis? Not falling for what we now call “survivorship bias.”
When making warplanes, you need to consider armor. But armor is heavy. And heavier planes are slower and less fuel efficient. Not having enough armor and having too much armor are both problems. So, Wald was assigned to calculate the optimum amount. He was presented with data from engagements all over Europe. The engineers noted that the planes in combat had far more shots on the fuselage and wings – they concluded that these areas were in need of reinforcement.
But Wald knew that sometimes “the most important data is the data you don't have.”
Wald saw the most important data was the data that answered the question “where do planes that don’t come back get shot?”
The planes that returned safely had more shots on the areas that can handle more shots. Wald concluded that the areas with fewer recorded shots needed the most armor.
Wald is credited with “saving the lives of countless flight crews who likely would have been shot down if their most vulnerable parts were left exposed.”
5. Climate Change
It is hard to write an article on data analysis and not mention climate change. It is also hard, however, to describe the data analysis that has gone on so far as being “successful.” Although there has been a great deal of public awareness on the issues surrounding global climate impact the facts are still opaque to some people.
The first calculations of the greenhouse effect (in which heat is trapped close to the Earth’s surface) began in 1896, with Swedish scientist Svante Arrhenius calculating that a doubling of atmospheric carbon dioxide (CO2) would give a total warming of 5–6 degrees Celsius. Arrhenius’ ideas were further developed in 1899, by Thomas Chrowder Chamberlin.
Until the 1950s, most scientists disputed or ignored the greenhouse theory developed by Arrhenius. In the 1950s, better spectrography, isotope analysis, and understanding of ocean chemistry led to a larger number of scientists arguing that CO2 could be a problem and that CO2 concentration was, in fact, rising.
Throughout the following years, the consensus that the atmospheric concentration of human-produced CO2 is increasing, and that this will have a detrimental impact on global climate, has only grown stronger. Subsequent data collection and analysis have birthed entire fields of science dedicated to climate change research.
6. Bernard Widrow and Marcian Hoff
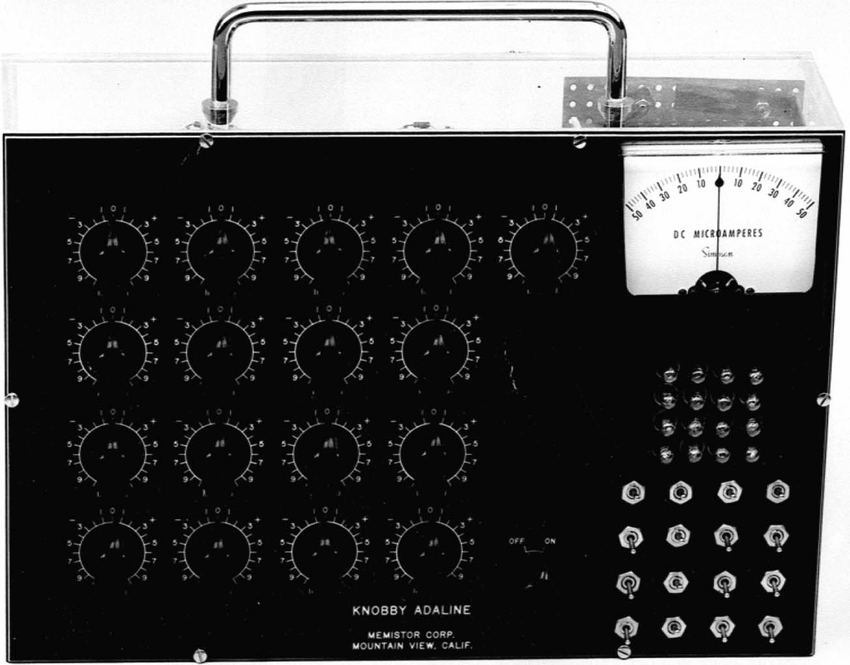
From the global and the complex to a smaller, but still very influential breakthrough: the first neural network to be implemented to solve a real world problem. As part of his PhD dissertation at Stanford, Marcian Hoff co-invented an analog neural network with Bernard Widrow. The analog neural network was a machine that could learn.
You might say that doesn’t seem like an example of data analysis, but it is. And a very important one at that. Widrow and Hoff invented a machine and an algorithm that could perform the conscious loop. It could:
Collect data
Analyze the data
Act (or make a prediction)
Learn from its actions.
The machine was called ADALINE.
ADALINE could be used for anything from balancing a broom on a moving rail to predicting tomorrow’s weather better than a human forecaster. It was eventually used in signal processing, where it was used to filter echoes in telephone signals.
Widrow predicted that within 10 years of their invention, adaptive computers would be just as widespread as digital computers. The prediction was incorrect, but it proved to be prophetic. More than sixty-five years after their initial conception, neural networks – with their ability to complete the conscious loop inside computers – are becoming widespread in almost every industry. Cars use neural networks to navigate, search engines use them to provide results, doctors use them to analyze patient data, supermarkets use them to stock shelves, etc. Their importance in data analysis will only grow from here.
If you want to learn more about Widrow’s contributions, this is an excellent interview.
7. Moneyball

This section takes its name from the 2003 book by Michael Lewis and 2011 film of the same name. I can recommend watching the movie if you haven’t already, as it is an excellent example of how to use data analysis for a competitive advantage. For those of you who don’t plan on watching the movie or don’t care about spoilers, here is a short summary.
The narrative follows Oakland Athletics baseball team manager Billy Beane’s attempts to field a competitive team with a very limited budget. Beane finds undervalued, talented players by using baseball statistics to evaluate performance instead of the more favored ‘intuitive’ scouting techniques of the past. Beane’s team went on to win 20 consecutive games, a record-breaking streak that solidified data analysis as a force to be reckoned with in the world of baseball.
8. Michael Burry

Another example from Hollywood is the award-winning film: The Big Short (2015). The movie tells the story of hedge fund manager Michael Burry’s analysis of – and bet against – subprime mortgages that made him rich in the aftermath of the 2008 U.S. financial crisis.
Burry analyzed data on mortgage lending practices and correctly predicted that the U.S. housing market would collapse as early as 2007.
The crisis was already at a point of no return and Burry knew this. Instead of trying to prevent the crisis, he managed to profit from it. His hedge fund, Scion Capital, “ultimately recorded returns of 489.34% (net of fees and expenses) between its November 1, 2000 inception and June 2008.”
9. AlexNet

AlexNet is a convolutional neural network (CNN). CNNs are extremely complicated in how they work, but quite simple in what they do. They usually work on image data. Given a data set of labeled images they can try to predict the label of an unlabeled image.
You might already be familiar with them, but in 2012, CNNs were a relatively novel concept. Even more novel was this particular CNN’s use of a niche piece of hardware: the graphics processing unit (GPU).
GPUs are very good at processing image data, as they are very good at calculating matrix operations in parallel. All this means is that instead of doing calculations (like 2*2) in sequence, very quickly, they can do the following in one giant computational step:
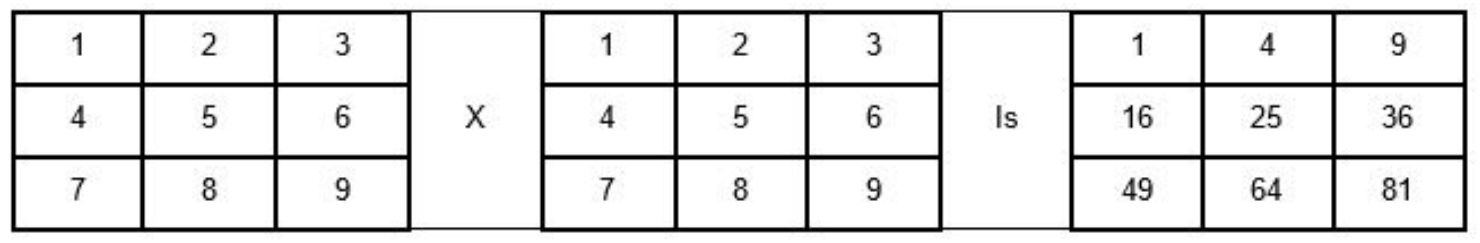
Traditionally, GPUs were only really used for gaming. But with AlexNet, they could be used to greatly accelerate CNNs and other big data analysis applications, leading to the machine learning (ML) revolution of the present day.
10. Audit
Consider leading professional services firms around the world and their roles in providing assurance (including financial audit), tax, consulting, and advisory services to companies. They deliver external audit services to their clients, examining financial records and operational procedures to assess for regulatory compliance. If the organizations do their jobs right, their customers can do their jobs right – avoiding millions in government fines.
Audits are traditionally highly manual, labor-intensive, and lengthy activities involving in-person interviews, data sampling, and the manual documentation of processes and risks. Audits are a feat of data analysis if ever there was one, but it doesn’t stop there!
As businesses are supported by an ever growing number of complex systems and big data sets, traditional audit measures are insufficient in capturing all audit risks and breaches.
Along comes process mining! (okay, shameless plug but bear with me). UiPath Process Mining (part of the UiPath Platform) automatically reconstructs processes based on factual client data and controls (automatic data collection and processing). Process Mining provides auditors with transparency and full audit coverage by delivering a holistic view of their client’s business processes.
Using its proprietary technology, UiPath Process Mining allows organizations to deliver multi–dimensional process maps in real time to identify audit risks and compliance breaches. We’ve seen this in action with a number of our customers.
Using UiPath Process Mining, auditors are able to complete the conscious loop for clients. They can collect, process, analyze, and act on data in near real time, allowing for rapid iteration and fact-based, goal-oriented business transformation.
Conclusion
As the wheel of time has turned, increasingly complex conscious loops have come into being, and their iteration has accelerated. Data analysis has evolved from expensive, incomplete, and time-consuming censuses in the ancient world, to the real-time analysis of minutely detailed business process information. In the future, we expect this iterative loop to turn faster and faster, further incorporating machine learning, automated task analysis, and big-picture strategic overviews to accelerate business evolution.
The impact of “big data” analytics is often manifested by thousands—or more—of incrementally small improvements. If an organization can atomize a single process into its smallest parts and implement advances where possible, the payoffs can be profound. And if an organization can systematically combine small improvements across bigger, multiple processes, the payoff can be exponential.”
Find out how to get more business value from your process analytics. Or, if you’re ready to see the benefits UiPath Process Mining can bring to your organization, check out our on-demand webinar.

Founder, Dembrane
Related articles


Get articles from automation experts in your inbox
Sign up today and we'll email you the newest articles every week.
Thank you for subscribing!
Thank you for subscribing! Each week, we'll send the best automation blog posts straight to your inbox.
Get articles from automation experts in your inbox
Sign up today and we'll email you the newest articles every week.
Thank you for subscribing!
Thank you for subscribing! Each week, we'll send the best automation blog posts straight to your inbox.